Automation Risk
Each occupation shows a probability of automation. A higher score means machines and algorithms are more likely to take over the role in the future.
| SUMMARY |
48%
Moderate Risk
|
12%
Minimal Risk
|
23%
Low Risk
|
33%
Low Risk
|
33%
Low Risk
|
31%
Low Risk
|
| JOB SCORE | 4.2/10 | 8.3/10 | 6.0/10 | 4.2/10 | 4.3/10 | 4.5/10 |
| POLLING |
There hasn't been enough votes on this occupation yet
|
29%
(Low Risk,
Based on 332 votes)
|
50%
(Moderate Risk,
Based on 32 votes)
|
53%
(Moderate Risk,
Based on 239 votes)
|
49%
(Moderate Risk,
Based on 62 votes)
|
54%
(Moderate Risk,
Based on 17 votes)
|
|
GROWTH
by year 2034
|
1.7%
|
8.7%
|
3.7%
|
1.7%
|
3.5%
|
4.0%
|
| WAGES |
$61,890
or $29.75 per hour
|
$100,590
or $48.36 per hour
|
$161,180
or $77.48 per hour
|
$61,890
or $29.75 per hour
|
$52,000
or $25.00 per hour
|
$71,490
or $34.37 per hour
|
|
VOLUME
as of 2024
|
343,040
|
156,300
|
100,870
|
343,040
|
76,190
|
4,660
|
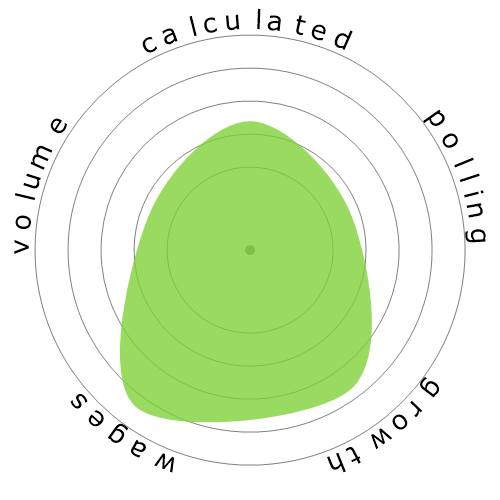
| SNOWFLAKE |

|

|
|

|

|

|
| DESCRIPTION | Analyze chromosomes or chromosome segments found in biological specimens, such as amniotic fluids, bone marrow, solid tumors, and blood to aid in the study, diagnosis, classification, or treatment of inherited or acquired genetic diseases. Conduct analyses through classical cytogenetic, fluorescent in situ hybridization (FISH) or array comparative genome hybridization (aCGH) techniques. | Conduct research dealing with the understanding of human diseases and the improvement of human health. Engage in clinical investigation, research and development, or other related activities. | Plan, direct, or coordinate clinical research projects. Direct the activities of workers engaged in clinical research projects to ensure compliance with protocols and overall clinical objectives. May evaluate and analyze clinical data. | Perform complex medical laboratory tests for diagnosis, treatment, and prevention of disease. May train or supervise staff. | Assist biological and medical scientists. Set up, operate, and maintain laboratory instruments and equipment, monitor experiments, collect data and samples, make observations, and calculate and record results. May analyze organic substances, such as blood, food, and drugs. | Apply principles and methods of bioinformatics to assist scientists in areas such as pharmaceuticals, medical technology, biotechnology, computational biology, proteomics, computer information science, biology and medical informatics. Apply bioinformatics tools to visualize, analyze, manipulate or interpret molecular data. May build and maintain databases for processing and analyzing genomic or other biological information. |
Curious how automation and AI could affect your career? Our comparison tool lets you view two or more jobs side by side, helping you quickly spot differences in risk level, pay, growth, and popularity. All of this is based on a mix of academic research, user polling, and official labour data.
Each occupation shows a probability of automation. A higher score means machines and algorithms are more likely to take over the role in the future.
A quick summary of how a job performs overall — factoring in wages, growth, volume, and automation risk. It’s a handy way to see the bigger picture at a glance.
Thousands of visitors cast their votes on how “automatable” each job feels. These community insights are shown alongside the calculated probabilities.
See how fast each occupation is projected to grow and what people earn on average. High wages don’t always mean high security — automation risk still matters.
Explore how many people currently work in each occupation and in which year the data was recorded. Popularity can affect how disruptive automation will be for the wider economy.
Each snowflake visualises the balance between automation risk, wages, growth, and job volume. Bigger and greener areas mean stronger performance in that dimension.
Use this comparison page to research careers, guide students, or simply explore the future of work. All data is regularly updated to keep the results relevant.