Automation Risk
Each occupation shows a probability of automation. A higher score means machines and algorithms are more likely to take over the role in the future.
| SUMMARY |
80%
High Risk
|
28%
Low Risk
|
38%
Low Risk
|
62%
High Risk
|
66%
High Risk
|
74%
High Risk
|
| JOB SCORE | 1.9/10 | 3.8/10 | 4.0/10 | 4.4/10 | 3.2/10 | 2.7/10 |
| POLLING |
81%
(Imminent Risk,
Based on 31 votes)
|
58%
(Moderate Risk,
Based on 16 votes)
|
37%
(Low Risk,
Based on 77 votes)
|
There hasn't been enough votes on this occupation yet
|
66%
(High Risk,
Based on 39 votes)
|
66%
(High Risk,
Based on 53 votes)
|
|
GROWTH
by year 2034
|
3.6%
|
1.0%
|
-6.5%
|
3.3%
|
5.4%
|
0.0%
|
| WAGES |
$41,460
or $19.93 per hour
|
$48,490
or $23.31 per hour
|
$58,260
or $28.01 per hour
|
$57,090
or $27.44 per hour
|
$33,800
or $16.25 per hour
|
$47,460
or $22.82 per hour
|
|
VOLUME
as of 2024
|
13,890
|
50,570
|
126,750
|
127,410
|
195,360
|
591,180
|
| SNOWFLAKE |

|

|

|
|

|

|
| DESCRIPTION | Operate or tend machines to wash or clean products, such as barrels or kegs, glass items, tin plate, food, pulp, coal, plastic, or rubber, to remove impurities. | Identify, remove, pack, transport, or dispose of hazardous materials, including asbestos, lead-based paint, waste oil, fuel, transmission fluid, radioactive materials, or contaminated soil. Specialized training and certification in hazardous materials handling or a confined entry permit are generally required. May operate earth-moving equipment or trucks. | Operate or control an entire process or system of machines, often through the use of control boards, to transfer or treat water or wastewater. | Operate or tend equipment to control chemical changes or reactions in the processing of industrial or consumer products. Equipment used includes devulcanizers, steam-jacketed kettles, and reactor vessels. | Operate or tend washing or dry-cleaning machines to wash or dry-clean industrial or household articles, such as cloth garments, suede, leather, furs, blankets, draperies, linens, rugs, and carpets. Includes spotters and dyers of these articles. | Inspect, test, sort, sample, or weigh nonagricultural raw materials or processed, machined, fabricated, or assembled parts or products for defects, wear, and deviations from specifications. May use precision measuring instruments and complex test equipment. |
Curious how automation and AI could affect your career? Our comparison tool lets you view two or more jobs side by side, helping you quickly spot differences in risk level, pay, growth, and popularity. All of this is based on a mix of academic research, user polling, and official labour data.
Each occupation shows a probability of automation. A higher score means machines and algorithms are more likely to take over the role in the future.
A quick summary of how a job performs overall — factoring in wages, growth, volume, and automation risk. It’s a handy way to see the bigger picture at a glance.
Thousands of visitors cast their votes on how “automatable” each job feels. These community insights are shown alongside the calculated probabilities.
See how fast each occupation is projected to grow and what people earn on average. High wages don’t always mean high security — automation risk still matters.
Explore how many people currently work in each occupation and in which year the data was recorded. Popularity can affect how disruptive automation will be for the wider economy.
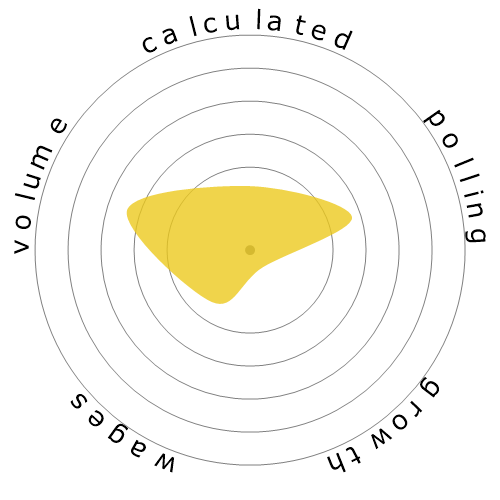
Each snowflake visualises the balance between automation risk, wages, growth, and job volume. Bigger and greener areas mean stronger performance in that dimension.
Use this comparison page to research careers, guide students, or simply explore the future of work. All data is regularly updated to keep the results relevant.