Automation Risk
Each occupation shows a probability of automation. A higher score means machines and algorithms are more likely to take over the role in the future.
| SUMMARY |
84%
Imminent Risk
|
50%
Moderate Risk
|
38%
Low Risk
|
66%
High Risk
|
69%
High Risk
|
74%
High Risk
|
| JOB SCORE | 2.2/10 | 4.9/10 | 5.2/10 | 3.5/10 | 3.4/10 | 2.7/10 |
| POLLING |
53%
(Moderate Risk,
Based on 99 votes)
|
47%
(Moderate Risk,
Based on 64 votes)
|
54%
(Moderate Risk,
Based on 29 votes)
|
54%
(Moderate Risk,
Based on 203 votes)
|
There hasn't been enough votes on this occupation yet
|
66%
(High Risk,
Based on 53 votes)
|
|
GROWTH
by year 2034
|
-9.0%
|
2.4%
|
1.2%
|
0.0%
|
-5.4%
|
0.0%
|
| WAGES |
$47,060
or $22.62 per hour
|
$60,850
or $29.25 per hour
|
$71,190
or $34.22 per hour
|
$56,150
or $26.99 per hour
|
$61,870
or $29.74 per hour
|
$47,460
or $22.82 per hour
|
|
VOLUME
as of 2024
|
36,290
|
117,470
|
685,140
|
298,790
|
5,610
|
591,180
|
| SNOWFLAKE |

|

|

|
|

|

|
| DESCRIPTION | Set up, operate, or tend welding, soldering, or brazing machines or robots that weld, braze, solder, or heat treat metal products, components, or assemblies. Includes workers who operate laser cutters or laser-beam machines. | Fabricate, assemble, install, and repair sheet metal products and equipment, such as ducts, control boxes, drainpipes, and furnace casings. Work may involve any of the following: setting up and operating fabricating machines to cut, bend, and straighten sheet metal; shaping metal over anvils, blocks, or forms using hammer; operating soldering and welding equipment to join sheet metal parts; or inspecting, assembling, and smoothing seams and joints of burred surfaces. Includes sheet metal duct installers who install prefabricated sheet metal ducts used for heating, air conditioning, or other purposes. | Directly supervise and coordinate the activities of production and operating workers, such as inspectors, precision workers, machine setters and operators, assemblers, fabricators, and plant and system operators. Excludes team or work leaders. | Set up and operate a variety of machine tools to produce precision parts and instruments out of metal. Includes precision instrument makers who fabricate, modify, or repair mechanical instruments. May also fabricate and modify parts to make or repair machine tools or maintain industrial machines, applying knowledge of mechanics, mathematics, metal properties, layout, and machining procedures. | Lay out reference points and dimensions on metal or plastic stock or workpieces, such as sheets, plates, tubes, structural shapes, castings, or machine parts, for further processing. Includes shipfitters. | Inspect, test, sort, sample, or weigh nonagricultural raw materials or processed, machined, fabricated, or assembled parts or products for defects, wear, and deviations from specifications. May use precision measuring instruments and complex test equipment. |
Curious how automation and AI could affect your career? Our comparison tool lets you view two or more jobs side by side, helping you quickly spot differences in risk level, pay, growth, and popularity. All of this is based on a mix of academic research, user polling, and official labour data.
Each occupation shows a probability of automation. A higher score means machines and algorithms are more likely to take over the role in the future.
A quick summary of how a job performs overall — factoring in wages, growth, volume, and automation risk. It’s a handy way to see the bigger picture at a glance.
Thousands of visitors cast their votes on how “automatable” each job feels. These community insights are shown alongside the calculated probabilities.
See how fast each occupation is projected to grow and what people earn on average. High wages don’t always mean high security — automation risk still matters.
Explore how many people currently work in each occupation and in which year the data was recorded. Popularity can affect how disruptive automation will be for the wider economy.
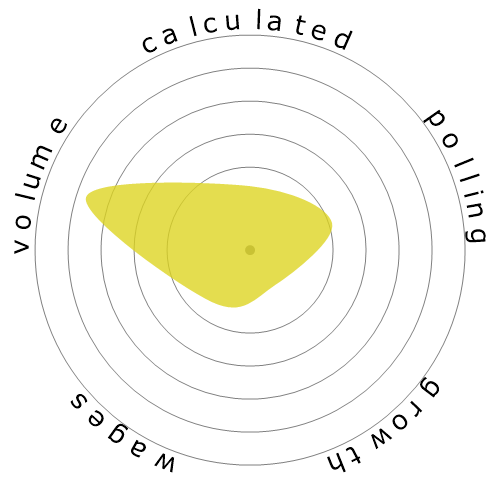
Each snowflake visualises the balance between automation risk, wages, growth, and job volume. Bigger and greener areas mean stronger performance in that dimension.
Use this comparison page to research careers, guide students, or simply explore the future of work. All data is regularly updated to keep the results relevant.