Automation Risk
Each occupation shows a probability of automation. A higher score means machines and algorithms are more likely to take over the role in the future.
| SUMMARY |
50%
Moderate Risk
|
28%
Low Risk
|
21%
Low Risk
|
32%
Low Risk
|
25%
Low Risk
|
38%
Low Risk
|
| JOB SCORE | 3.8/10 | 3.8/10 | 6.4/10 | 3.8/10 | 5.5/10 | 3.2/10 |
| POLLING |
There hasn't been enough votes on this occupation yet
|
58%
(Moderate Risk,
Based on 16 votes)
|
34%
(Low Risk,
Based on 28 votes)
|
46%
(Moderate Risk,
Based on 18 votes)
|
38%
(Low Risk,
Based on 67 votes)
|
42%
(Moderate Risk,
Based on 21 votes)
|
|
GROWTH
by year 2034
|
2.9%
|
1.0%
|
8.5%
|
-0.9%
|
-0.8%
|
1.5%
|
| WAGES |
$59,600
or $28.65 per hour
|
$48,490
or $23.31 per hour
|
$58,440
or $28.09 per hour
|
$59,110
or $28.42 per hour
|
$72,120
or $34.67 per hour
|
$48,390
or $23.26 per hour
|
|
VOLUME
as of 2024
|
17,410
|
50,570
|
31,450
|
5,680
|
137,210
|
9,710
|
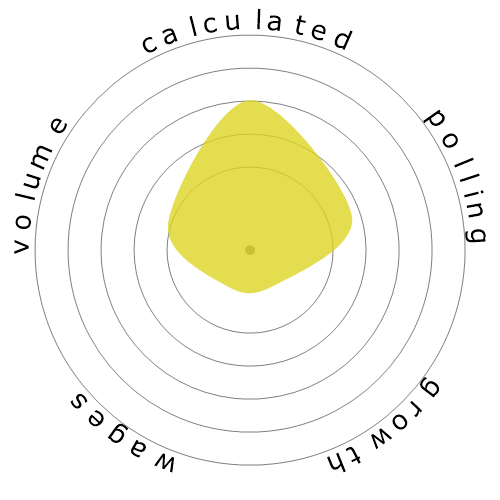
| SNOWFLAKE |

|
|

|

|

|

|
| DESCRIPTION | Operate a variety of drills such as rotary, churn, and pneumatic to tap subsurface water and salt deposits, to remove core samples during mineral exploration or soil testing, and to facilitate the use of explosives in mining or construction. Includes horizontal and earth boring machine operators. | Identify, remove, pack, transport, or dispose of hazardous materials, including asbestos, lead-based paint, waste oil, fuel, transmission fluid, radioactive materials, or contaminated soil. Specialized training and certification in hazardous materials handling or a confined entry permit are generally required. May operate earth-moving equipment or trucks. | Collect data on work environments for analysis by occupational health and safety specialists. Implement and conduct evaluation of programs designed to limit chemical, physical, biological, and ergonomic risks to workers. | Place and detonate explosives to demolish structures or to loosen, remove, or displace earth, rock, or other materials. May perform specialized handling, storage, and accounting procedures. | Inspect structures using engineering skills to determine structural soundness and compliance with specifications, building codes, and other regulations. Inspections may be general in nature or may be limited to a specific area, such as electrical systems or plumbing. | Assist scientists or engineers in the use of electronic, sonic, or nuclear measuring instruments in laboratory, exploration, and production activities to obtain data indicating resources such as metallic ore, minerals, gas, coal, or petroleum. Analyze mud and drill cuttings. Chart pressure, temperature, and other characteristics of wells or bore holes. |
Curious how automation and AI could affect your career? Our comparison tool lets you view two or more jobs side by side, helping you quickly spot differences in risk level, pay, growth, and popularity. All of this is based on a mix of academic research, user polling, and official labour data.
Each occupation shows a probability of automation. A higher score means machines and algorithms are more likely to take over the role in the future.
A quick summary of how a job performs overall — factoring in wages, growth, volume, and automation risk. It’s a handy way to see the bigger picture at a glance.
Thousands of visitors cast their votes on how “automatable” each job feels. These community insights are shown alongside the calculated probabilities.
See how fast each occupation is projected to grow and what people earn on average. High wages don’t always mean high security — automation risk still matters.
Explore how many people currently work in each occupation and in which year the data was recorded. Popularity can affect how disruptive automation will be for the wider economy.
Each snowflake visualises the balance between automation risk, wages, growth, and job volume. Bigger and greener areas mean stronger performance in that dimension.
Use this comparison page to research careers, guide students, or simply explore the future of work. All data is regularly updated to keep the results relevant.