Automation Risk
Each occupation shows a probability of automation. A higher score means machines and algorithms are more likely to take over the role in the future.
| SUMMARY |
64%
High Risk
|
46%
Moderate Risk
|
51%
Moderate Risk
|
53%
Moderate Risk
|
45%
Moderate Risk
|
55%
Moderate Risk
|
| JOB SCORE | 4.2/10 | 6.8/10 | 5.2/10 | 4.4/10 | 3.7/10 | 4.7/10 |
| POLLING |
There hasn't been enough votes on this occupation yet
|
29%
(Low Risk,
Based on 49 votes)
|
50%
(Moderate Risk,
Based on 286 votes)
|
44%
(Moderate Risk,
Based on 26 votes)
|
69%
(High Risk,
Based on 18 votes)
|
35%
(Low Risk,
Based on 43 votes)
|
|
GROWTH
by year 2034
|
3.2%
|
5.8%
|
7.3%
|
3.0%
|
3.7%
|
1.8%
|
| WAGES |
$51,650
or $24.83 per hour
|
$63,980
or $30.76 per hour
|
$46,730
or $22.46 per hour
|
$49,070
or $23.59 per hour
|
$58,480
or $28.11 per hour
|
$54,660
or $26.28 per hour
|
|
VOLUME
as of 2024
|
45,680
|
180,270
|
1,057,660
|
151,750
|
7,580
|
205,230
|
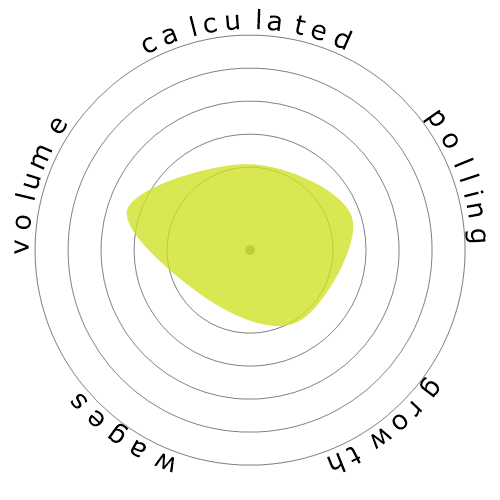
| SNOWFLAKE |

|

|

|
|

|

|
| DESCRIPTION | Operate equipment used for applying concrete, asphalt, or other materials to road beds, parking lots, or airport runways and taxiways or for tamping gravel, dirt, or other materials. Includes concrete and asphalt paving machine operators, form tampers, tamping machine operators, and stone spreader operators. | Diagnose, adjust, repair, or overhaul mobile mechanical, hydraulic, and pneumatic equipment, such as cranes, bulldozers, graders, and conveyors, used in construction, logging, and mining. | Perform tasks involving physical labor at construction sites. May operate hand and power tools of all types: air hammers, earth tampers, cement mixers, small mechanical hoists, surveying and measuring equipment, and a variety of other equipment and instruments. May clean and prepare sites, dig trenches, set braces to support the sides of excavations, erect scaffolding, and clean up rubble, debris, and other waste materials. May assist other craft workers. | Maintain highways, municipal and rural roads, airport runways, and rights-of-way. Duties include patching broken or eroded pavement and repairing guard rails, highway markers, and snow fences. May also mow or clear brush from along road, or plow snow from roadway. | Conduct field studies to determine traffic volume, speed, effectiveness of signals, adequacy of lighting, and other factors influencing traffic conditions, under direction of traffic engineer. | Smooth and finish surfaces of poured concrete, such as floors, walks, sidewalks, roads, or curbs using a variety of hand and power tools. Align forms for sidewalks, curbs, or gutters; patch voids; and use saws to cut expansion joints. |
Curious how automation and AI could affect your career? Our comparison tool lets you view two or more jobs side by side, helping you quickly spot differences in risk level, pay, growth, and popularity. All of this is based on a mix of academic research, user polling, and official labour data.
Each occupation shows a probability of automation. A higher score means machines and algorithms are more likely to take over the role in the future.
A quick summary of how a job performs overall — factoring in wages, growth, volume, and automation risk. It’s a handy way to see the bigger picture at a glance.
Thousands of visitors cast their votes on how “automatable” each job feels. These community insights are shown alongside the calculated probabilities.
See how fast each occupation is projected to grow and what people earn on average. High wages don’t always mean high security — automation risk still matters.
Explore how many people currently work in each occupation and in which year the data was recorded. Popularity can affect how disruptive automation will be for the wider economy.
Each snowflake visualises the balance between automation risk, wages, growth, and job volume. Bigger and greener areas mean stronger performance in that dimension.
Use this comparison page to research careers, guide students, or simply explore the future of work. All data is regularly updated to keep the results relevant.