Automation Risk
Each occupation shows a probability of automation. A higher score means machines and algorithms are more likely to take over the role in the future.
| SUMMARY |
59%
Moderate Risk
|
29%
Low Risk
|
32%
Low Risk
|
44%
Moderate Risk
|
47%
Moderate Risk
|
32%
Low Risk
|
| JOB SCORE | 3.4/10 | 6.0/10 | 4.0/10 | 6.0/10 | 4.0/10 | 5.4/10 |
| POLLING |
72%
(High Risk,
Based on 46 votes)
|
52%
(Moderate Risk,
Based on 48 votes)
|
52%
(Moderate Risk,
Based on 60 votes)
|
40%
(Moderate Risk,
Based on 47 votes)
|
50%
(Moderate Risk,
Based on 105 votes)
|
39%
(Low Risk,
Based on 248 votes)
|
|
GROWTH
by year 2034
|
3.1%
|
5.8%
|
-5.0%
|
5.8%
|
0.3%
|
1.9%
|
| WAGES |
$37,440
or $18.00 per hour
|
$75,650
or $36.37 per hour
|
$47,320
or $22.75 per hour
|
$75,650
or $36.37 per hour
|
$66,780
or $32.10 per hour
|
$100,070
or $48.11 per hour
|
|
VOLUME
as of 2024
|
265,060
|
486,900
|
1,113,160
|
486,900
|
1,266,860
|
293,930
|
| SNOWFLAKE |

|

|

|

|

|
|
| DESCRIPTION | Sell spare and replacement parts and equipment in repair shop or parts store. | Purchase machinery, equipment, tools, parts, supplies, or services necessary for the operation of an establishment. Purchase raw or semifinished materials for manufacturing. May negotiate contracts. | Directly supervise and coordinate activities of retail sales workers in an establishment or department. Duties may include management functions, such as purchasing, budgeting, accounting, and personnel work, in addition to supervisory duties. | Buy merchandise or commodities, other than farm products, for resale to consumers at the wholesale or retail level, including both durable and nondurable goods. Analyze past buying trends, sales records, price, and quality of merchandise to determine value and yield. Select, order, and authorize payment for merchandise according to contractual agreements. May conduct meetings with sales personnel and introduce new products. May negotiate contracts. Includes assistant wholesale and retail buyers of nonfarm products. | Sell goods for wholesalers or manufacturers to businesses or groups of individuals. Work requires substantial knowledge of items sold. | Sell goods for wholesalers or manufacturers where technical or scientific knowledge is required in such areas as biology, engineering, chemistry, and electronics, normally obtained from at least 2 years of postsecondary education. |
Curious how automation and AI could affect your career? Our comparison tool lets you view two or more jobs side by side, helping you quickly spot differences in risk level, pay, growth, and popularity. All of this is based on a mix of academic research, user polling, and official labour data.
Each occupation shows a probability of automation. A higher score means machines and algorithms are more likely to take over the role in the future.
A quick summary of how a job performs overall — factoring in wages, growth, volume, and automation risk. It’s a handy way to see the bigger picture at a glance.
Thousands of visitors cast their votes on how “automatable” each job feels. These community insights are shown alongside the calculated probabilities.
See how fast each occupation is projected to grow and what people earn on average. High wages don’t always mean high security — automation risk still matters.
Explore how many people currently work in each occupation and in which year the data was recorded. Popularity can affect how disruptive automation will be for the wider economy.
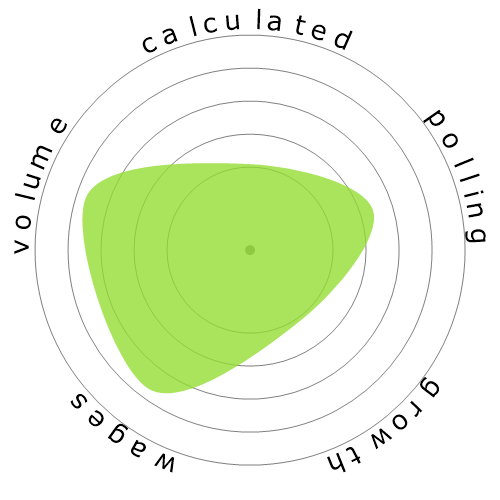
Each snowflake visualises the balance between automation risk, wages, growth, and job volume. Bigger and greener areas mean stronger performance in that dimension.
Use this comparison page to research careers, guide students, or simply explore the future of work. All data is regularly updated to keep the results relevant.