Automation Risk
Each occupation shows a probability of automation. A higher score means machines and algorithms are more likely to take over the role in the future.
| SUMMARY |
22%
Low Risk
|
9%
Minimal Risk
|
29%
Low Risk
|
30%
Low Risk
|
20%
Low Risk
|
| JOB SCORE | 6.8/10 | 8.3/10 | 6.1/10 | 5.6/10 | 7.8/10 |
| POLLING |
26%
(Low Risk,
Based on 118 votes)
|
16.0%
(Minimal Risk,
Based on 1,242 votes)
|
35%
(Low Risk,
Based on 20 votes)
|
46%
(Moderate Risk,
Based on 110 votes)
|
16.9%
(Minimal Risk,
Based on 34 votes)
|
|
GROWTH
by year 2034
|
2.6%
|
4.9%
|
17.0%
|
12.5%
|
19.2%
|
| WAGES |
$62,340
or $29.97 per hour
|
$93,600
or $45.00 per hour
|
$34,900
or $16.78 per hour
|
$44,200
or $21.25 per hour
|
$68,340
or $32.85 per hour
|
|
VOLUME
as of 2024
|
632,430
|
3,282,010
|
3,988,140
|
793,460
|
47,910
|
| SNOWFLAKE |
|

|

|

|

|
| DESCRIPTION | Care for ill, injured, or convalescing patients or persons with disabilities in hospitals, nursing homes, clinics, private homes, group homes, and similar institutions. May work under the supervision of a registered nurse. Licensing required. | Assess patient health problems and needs, develop and implement nursing care plans, and maintain medical records. Administer nursing care to ill, injured, convalescent, or disabled patients. May advise patients on health maintenance and disease prevention or provide case management. Licensing or registration required. | Monitor the health status of an individual with disabilities or illness, and address their health-related needs, such as changing bandages, dressing wounds, or administering medication. Work is performed under the direction of offsite or intermittent onsite licensed nursing staff. Provide assistance with routine healthcare tasks or activities of daily living, such as feeding, bathing, toileting, or ambulation. May also help with tasks such as preparing meals, doing light housekeeping, and doing laundry depending on the patient's abilities. | Perform administrative and certain clinical duties under the direction of a physician. Administrative duties may include scheduling appointments, maintaining medical records, billing, and coding information for insurance purposes. Clinical duties may include taking and recording vital signs and medical histories, preparing patients for examination, drawing blood, and administering medications as directed by physician. | Assist occupational therapists in providing occupational therapy treatments and procedures. May, in accordance with state laws, assist in development of treatment plans, carry out routine functions, direct activity programs, and document the progress of treatments. Generally requires formal training. |
Curious how automation and AI could affect your career? Our comparison tool lets you view two or more jobs side by side, helping you quickly spot differences in risk level, pay, growth, and popularity. All of this is based on a mix of academic research, user polling, and official labour data.
Each occupation shows a probability of automation. A higher score means machines and algorithms are more likely to take over the role in the future.
A quick summary of how a job performs overall — factoring in wages, growth, volume, and automation risk. It’s a handy way to see the bigger picture at a glance.
Thousands of visitors cast their votes on how “automatable” each job feels. These community insights are shown alongside the calculated probabilities.
See how fast each occupation is projected to grow and what people earn on average. High wages don’t always mean high security — automation risk still matters.
Explore how many people currently work in each occupation and in which year the data was recorded. Popularity can affect how disruptive automation will be for the wider economy.
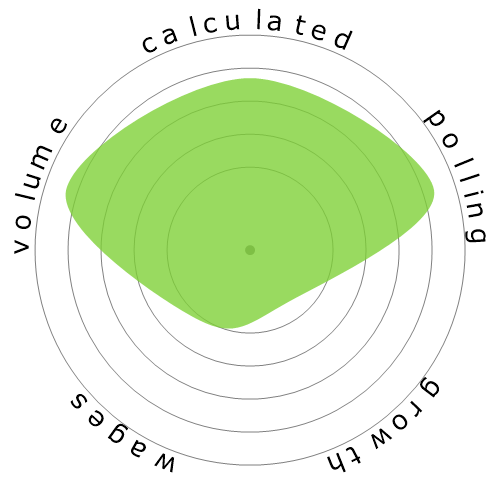
Each snowflake visualises the balance between automation risk, wages, growth, and job volume. Bigger and greener areas mean stronger performance in that dimension.
Use this comparison page to research careers, guide students, or simply explore the future of work. All data is regularly updated to keep the results relevant.