Automation Risk
Each occupation shows a probability of automation. A higher score means machines and algorithms are more likely to take over the role in the future.
| SUMMARY |
8%
Minimal Risk
|
7%
Minimal Risk
|
16%
Minimal Risk
|
6%
Minimal Risk
|
6%
Minimal Risk
|
| JOB SCORE | 6.4/10 | 7.1/10 | 6.2/10 | 6.0/10 | 6.3/10 |
| POLLING |
18.0%
(Minimal Risk,
Based on 32 votes)
|
19.3%
(Minimal Risk,
Based on 168 votes)
|
21%
(Low Risk,
Based on 127 votes)
|
25%
(Low Risk,
Based on 142 votes)
|
16.9%
(Minimal Risk,
Based on 37 votes)
|
|
GROWTH
by year 2034
|
1.4%
|
3.4%
|
4.1%
|
-1.6%
|
-1.8%
|
| WAGES |
$62,190
or $29.90 per hour
|
$58,570
or $28.16 per hour
|
$37,120
or $17.84 per hour
|
$61,430
or $29.53 per hour
|
$63,000
or $30.29 per hour
|
|
VOLUME
as of 2024
|
28,200
|
382,960
|
445,080
|
114,410
|
231,570
|
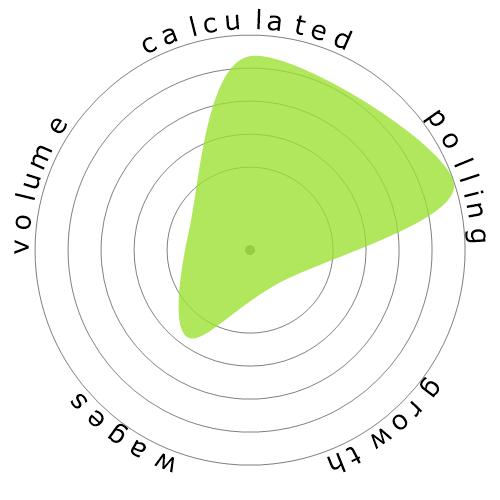
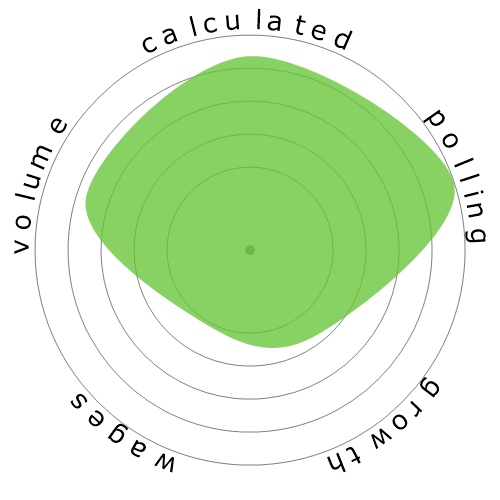
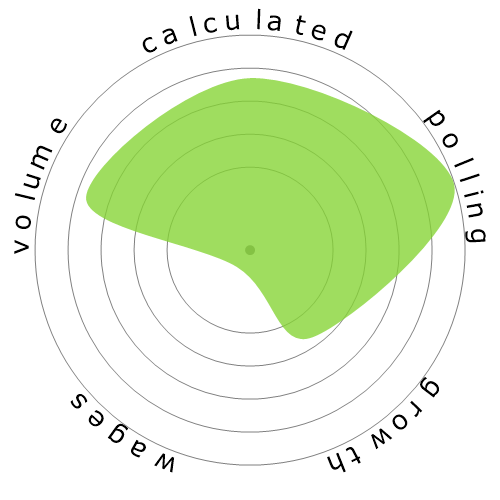
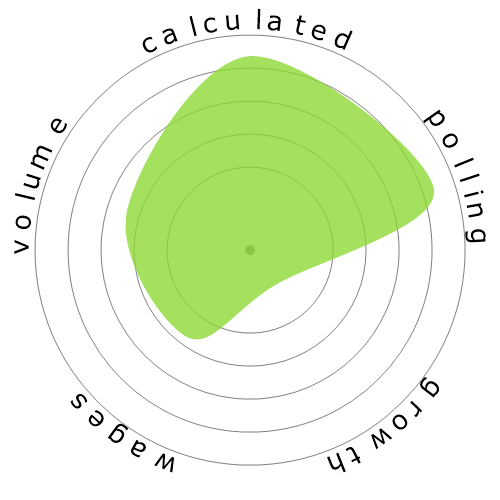
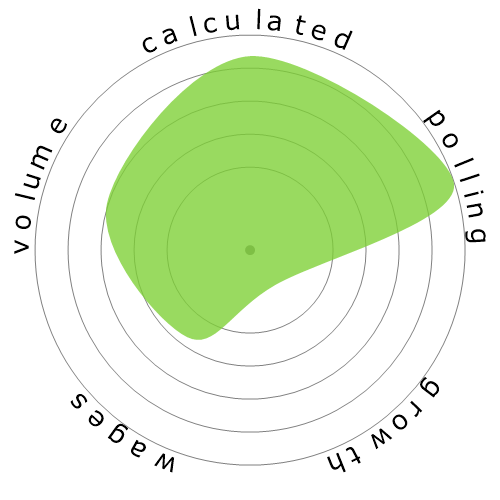
| SNOWFLAKE |
|
|
|
|
|
| DESCRIPTION | Teach academic, social, and life skills to preschool-aged students with learning, emotional, or physical disabilities. Includes teachers who specialize and work with students who are blind or have visual impairments; students who are deaf or have hearing impairments; and students with intellectual disabilities. | Provide social services and assistance to improve the social and psychological functioning of children and their families and to maximize the family well-being and the academic functioning of children. May assist parents, arrange adoptions, and find foster homes for abandoned or abused children. In schools, they address such problems as teenage pregnancy, misbehavior, and truancy. May also advise teachers. | Instruct preschool-aged students, following curricula or lesson plans, in activities designed to promote social, physical, and intellectual growth. | Teach academic and social skills to kindergarten students. | Teach academic, social, and life skills to elementary school students with learning, emotional, or physical disabilities. Includes teachers who specialize and work with students who are blind or have visual impairments; students who are deaf or have hearing impairments; and students with intellectual disabilities. |
Curious how automation and AI could affect your career? Our comparison tool lets you view two or more jobs side by side, helping you quickly spot differences in risk level, pay, growth, and popularity. All of this is based on a mix of academic research, user polling, and official labour data.
Each occupation shows a probability of automation. A higher score means machines and algorithms are more likely to take over the role in the future.
A quick summary of how a job performs overall — factoring in wages, growth, volume, and automation risk. It’s a handy way to see the bigger picture at a glance.
Thousands of visitors cast their votes on how “automatable” each job feels. These community insights are shown alongside the calculated probabilities.
See how fast each occupation is projected to grow and what people earn on average. High wages don’t always mean high security — automation risk still matters.
Explore how many people currently work in each occupation and in which year the data was recorded. Popularity can affect how disruptive automation will be for the wider economy.
Each snowflake visualises the balance between automation risk, wages, growth, and job volume. Bigger and greener areas mean stronger performance in that dimension.
Use this comparison page to research careers, guide students, or simply explore the future of work. All data is regularly updated to keep the results relevant.