Automation Risk
Each occupation shows a probability of automation. A higher score means machines and algorithms are more likely to take over the role in the future.
| SUMMARY |
38%
Low Risk
|
24%
Low Risk
|
28%
Low Risk
|
19%
Minimal Risk
|
32%
Low Risk
|
24%
Low Risk
|
| JOB SCORE | 3.2/10 | 5.1/10 | 4.4/10 | 6.7/10 | 4.3/10 | 6.0/10 |
| POLLING |
42%
(Moderate Risk,
Based on 21 votes)
|
There hasn't been enough votes on this occupation yet
|
33%
(Low Risk,
Based on 15 votes)
|
31%
(Low Risk,
Based on 192 votes)
|
There hasn't been enough votes on this occupation yet
|
There hasn't been enough votes on this occupation yet
|
|
GROWTH
by year 2034
|
1.5%
|
4.0%
|
1.2%
|
3.2%
|
3.5%
|
3.0%
|
| WAGES |
$48,390
or $23.26 per hour
|
$49,490
or $23.79 per hour
|
$58,890
or $28.31 per hour
|
$99,240
or $47.71 per hour
|
$60,130
or $28.91 per hour
|
$78,420
or $37.70 per hour
|
|
VOLUME
as of 2024
|
9,710
|
39,390
|
12,500
|
22,510
|
71,400
|
397,770
|
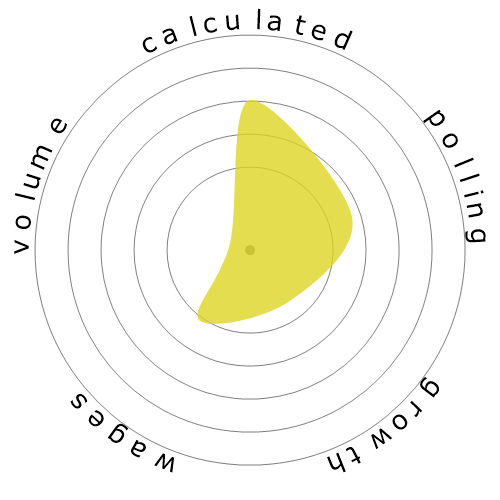
| SNOWFLAKE |

|

|
|

|

|

|
| DESCRIPTION | Assist scientists or engineers in the use of electronic, sonic, or nuclear measuring instruments in laboratory, exploration, and production activities to obtain data indicating resources such as metallic ore, minerals, gas, coal, or petroleum. Analyze mud and drill cuttings. Chart pressure, temperature, and other characteristics of wells or bore holes. | Perform laboratory and field tests to monitor the environment and investigate sources of pollution, including those that affect health, under the direction of an environmental scientist, engineer, or other specialist. May collect samples of gases, soil, water, and other materials for testing. | Apply theory and principles of environmental engineering to modify, test, and operate equipment and devices used in the prevention, control, and remediation of environmental problems, including waste treatment and site remediation, under the direction of engineering staff or scientists. May assist in the development of environmental remediation devices. | Study the composition, structure, and other physical aspects of the Earth. May use geological, physics, and mathematics knowledge in exploration for oil, gas, minerals, or underground water; or in waste disposal, land reclamation, or other environmental problems. May study the Earth's internal composition, atmospheres, and oceans, and its magnetic, electrical, and gravitational forces. Includes mineralogists, paleontologists, stratigraphers, geodesists, and seismologists. | Apply remote sensing technologies to assist scientists in areas such as natural resources, urban planning, or homeland security. May prepare flight plans or sensor configurations for flight trips. | Inspect and investigate sources of pollution to protect the public and environment and ensure conformance with Federal, State, and local regulations and ordinances. |
Curious how automation and AI could affect your career? Our comparison tool lets you view two or more jobs side by side, helping you quickly spot differences in risk level, pay, growth, and popularity. All of this is based on a mix of academic research, user polling, and official labour data.
Each occupation shows a probability of automation. A higher score means machines and algorithms are more likely to take over the role in the future.
A quick summary of how a job performs overall — factoring in wages, growth, volume, and automation risk. It’s a handy way to see the bigger picture at a glance.
Thousands of visitors cast their votes on how “automatable” each job feels. These community insights are shown alongside the calculated probabilities.
See how fast each occupation is projected to grow and what people earn on average. High wages don’t always mean high security — automation risk still matters.
Explore how many people currently work in each occupation and in which year the data was recorded. Popularity can affect how disruptive automation will be for the wider economy.
Each snowflake visualises the balance between automation risk, wages, growth, and job volume. Bigger and greener areas mean stronger performance in that dimension.
Use this comparison page to research careers, guide students, or simply explore the future of work. All data is regularly updated to keep the results relevant.