Automation Risk
Each occupation shows a probability of automation. A higher score means machines and algorithms are more likely to take over the role in the future.
| SUMMARY |
32%
Low Risk
|
11%
Minimal Risk
|
12%
Minimal Risk
|
20%
Minimal Risk
|
21%
Low Risk
|
25%
Low Risk
|
| JOB SCORE | 5.2/10 | 7.3/10 | 6.8/10 | 7.7/10 | 5.5/10 | 5.5/10 |
| POLLING |
49%
(Moderate Risk,
Based on 24 votes)
|
32%
(Low Risk,
Based on 47 votes)
|
32%
(Low Risk,
Based on 95 votes)
|
23%
(Low Risk,
Based on 153 votes)
|
43%
(Moderate Risk,
Based on 21 votes)
|
38%
(Low Risk,
Based on 67 votes)
|
|
GROWTH
by year 2034
|
1.5%
|
4.4%
|
4.9%
|
5.7%
|
1.7%
|
-0.8%
|
| WAGES |
$77,390
or $37.20 per hour
|
$109,660
or $52.72 per hour
|
$104,160
or $50.07 per hour
|
$108,310
or $52.07 per hour
|
$85,750
or $41.22 per hour
|
$72,120
or $34.67 per hour
|
|
VOLUME
as of 2024
|
64,410
|
23,220
|
8,330
|
22,770
|
23,320
|
137,210
|
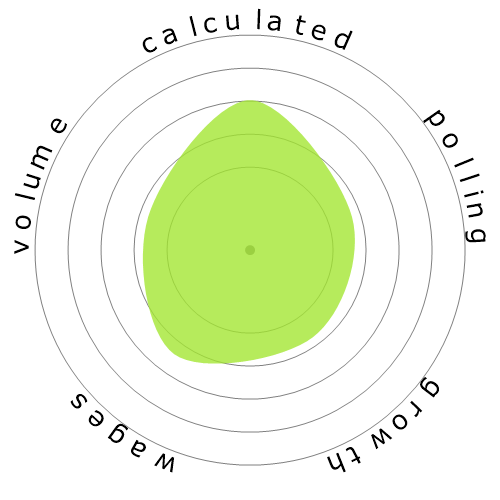
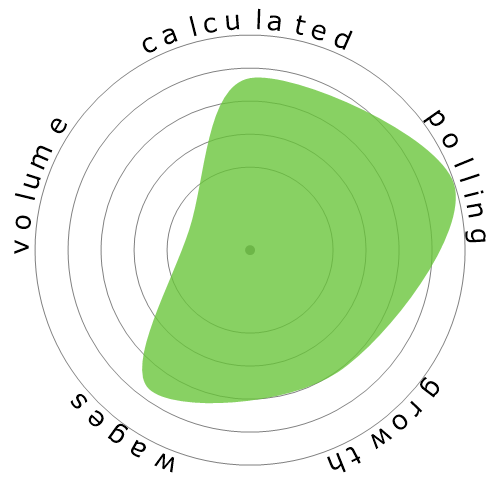
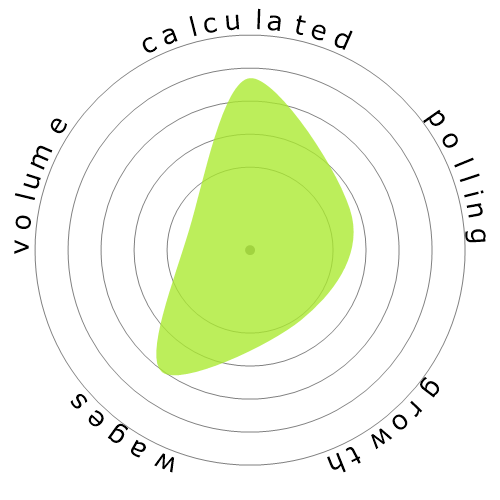
| SNOWFLAKE |
|

|

|
|
|

|
| DESCRIPTION | Test the safety of structures, vehicles, or vessels using x-ray, ultrasound, fiber optic or related equipment. | Promote worksite or product safety by applying knowledge of industrial processes, mechanics, chemistry, psychology, and industrial health and safety laws. Includes industrial product safety engineers. | Research and study the structures and chemical properties of various natural and synthetic or composite materials, including metals, alloys, rubber, ceramics, semiconductors, polymers, and glass. Determine ways to strengthen or combine materials or develop new materials with new or specific properties for use in a variety of products and applications. Includes glass scientists, ceramic scientists, metallurgical scientists, and polymer scientists. | Evaluate materials and develop machinery and processes to manufacture materials for use in products that must meet specialized design and performance specifications. Develop new uses for known materials. Includes those engineers working with composite materials or specializing in one type of material, such as graphite, metal and metal alloys, ceramics and glass, plastics and polymers, and naturally occurring materials. Includes metallurgists and metallurgical engineers, ceramic engineers, and welding engineers. | Inspect aircraft, maintenance procedures, air navigational aids, air traffic controls, and communications equipment to ensure conformance with Federal safety regulations. | Inspect structures using engineering skills to determine structural soundness and compliance with specifications, building codes, and other regulations. Inspections may be general in nature or may be limited to a specific area, such as electrical systems or plumbing. |
Curious how automation and AI could affect your career? Our comparison tool lets you view two or more jobs side by side, helping you quickly spot differences in risk level, pay, growth, and popularity. All of this is based on a mix of academic research, user polling, and official labour data.
Each occupation shows a probability of automation. A higher score means machines and algorithms are more likely to take over the role in the future.
A quick summary of how a job performs overall — factoring in wages, growth, volume, and automation risk. It’s a handy way to see the bigger picture at a glance.
Thousands of visitors cast their votes on how “automatable” each job feels. These community insights are shown alongside the calculated probabilities.
See how fast each occupation is projected to grow and what people earn on average. High wages don’t always mean high security — automation risk still matters.
Explore how many people currently work in each occupation and in which year the data was recorded. Popularity can affect how disruptive automation will be for the wider economy.
Each snowflake visualises the balance between automation risk, wages, growth, and job volume. Bigger and greener areas mean stronger performance in that dimension.
Use this comparison page to research careers, guide students, or simply explore the future of work. All data is regularly updated to keep the results relevant.