Automation Risk
Each occupation shows a probability of automation. A higher score means machines and algorithms are more likely to take over the role in the future.
| SUMMARY |
19%
Minimal Risk
|
10%
Minimal Risk
|
10%
Minimal Risk
|
20%
Low Risk
|
20%
Minimal Risk
|
| JOB SCORE | 4.6/10 | 7.1/10 | 7.6/10 | 5.4/10 | 7.0/10 |
| POLLING |
40%
(Moderate Risk,
Based on 15 votes)
|
32%
(Low Risk,
Based on 17 votes)
|
22%
(Low Risk,
Based on 78 votes)
|
There hasn't been enough votes on this occupation yet
|
36%
(Low Risk,
Based on 28 votes)
|
|
GROWTH
by year 2034
|
-2.5%
|
4.1%
|
5.4%
|
3.4%
|
4.5%
|
| WAGES |
$58,120
or $27.94 per hour
|
$86,350
or $41.51 per hour
|
$71,410
or $34.33 per hour
|
$77,280
or $37.15 per hour
|
$63,000
or $30.29 per hour
|
|
VOLUME
as of 2024
|
10,260
|
8,700
|
16,600
|
2,630
|
65,150
|
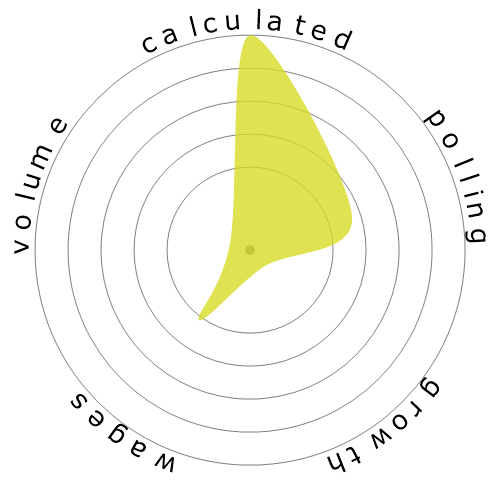
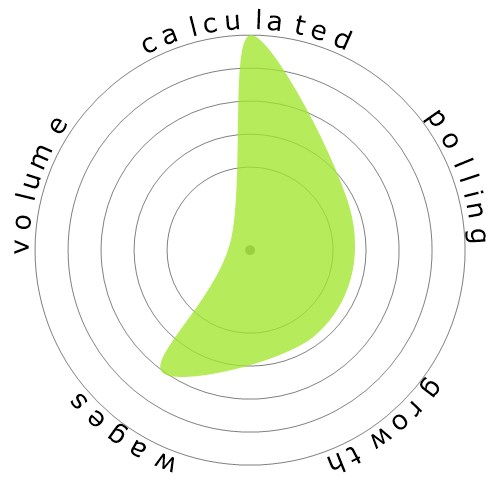
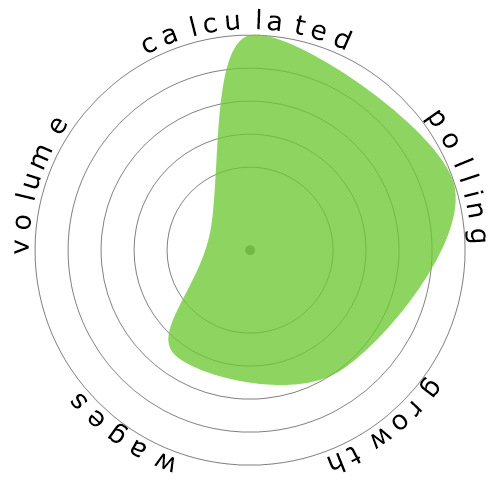
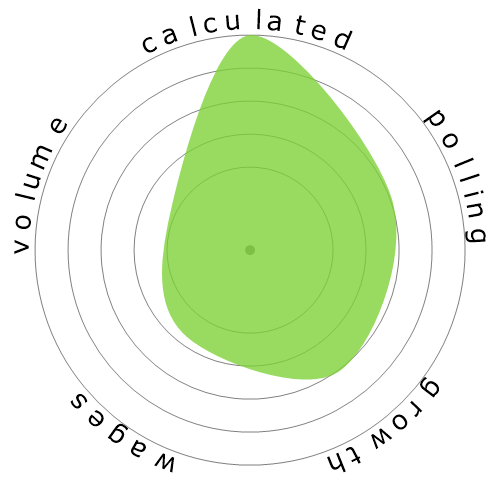
| SNOWFLAKE |
|
|
|

|
|
| DESCRIPTION | Instruct and advise individuals and families engaged in agriculture, agricultural-related processes, or home management activities. Demonstrate procedures and apply research findings to advance agricultural and home management activities. May develop educational outreach programs. May instruct on either agricultural issues such as agricultural processes and techniques, pest management, and food safety, or on home management issues such as budgeting, nutrition, and child development. | Teach courses in the agricultural sciences. Includes teachers of agronomy, dairy sciences, fisheries management, horticultural sciences, poultry sciences, range management, and agricultural soil conservation. Includes both teachers primarily engaged in teaching and those who do a combination of teaching and research. | Conduct research in breeding, physiology, production, yield, and management of crops and agricultural plants or trees, shrubs, and nursery stock, their growth in soils, and control of pests; or study the chemical, physical, biological, and mineralogical composition of soils as they relate to plant or crop growth. May classify and map soils and investigate effects of alternative practices on soil and crop productivity. | Teach courses in childcare, family relations, finance, nutrition, and related subjects pertaining to home management. Includes both teachers primarily engaged in teaching and those who do a combination of teaching and research. | Provide and manage health education programs that help individuals, families, and their communities maximize and maintain healthy lifestyles. Use data to identify community needs prior to planning, implementing, monitoring, and evaluating programs designed to encourage healthy lifestyles, policies, and environments. May link health systems, health providers, insurers, and patients to address individual and population health needs. May serve as resource to assist individuals, other health professionals, or the community, and may administer fiscal resources for health education programs. |
Curious how automation and AI could affect your career? Our comparison tool lets you view two or more jobs side by side, helping you quickly spot differences in risk level, pay, growth, and popularity. All of this is based on a mix of academic research, user polling, and official labour data.
Each occupation shows a probability of automation. A higher score means machines and algorithms are more likely to take over the role in the future.
A quick summary of how a job performs overall — factoring in wages, growth, volume, and automation risk. It’s a handy way to see the bigger picture at a glance.
Thousands of visitors cast their votes on how “automatable” each job feels. These community insights are shown alongside the calculated probabilities.
See how fast each occupation is projected to grow and what people earn on average. High wages don’t always mean high security — automation risk still matters.
Explore how many people currently work in each occupation and in which year the data was recorded. Popularity can affect how disruptive automation will be for the wider economy.
Each snowflake visualises the balance between automation risk, wages, growth, and job volume. Bigger and greener areas mean stronger performance in that dimension.
Use this comparison page to research careers, guide students, or simply explore the future of work. All data is regularly updated to keep the results relevant.