Automation Risk
Each occupation shows a probability of automation. A higher score means machines and algorithms are more likely to take over the role in the future.
| SUMMARY |
77%
High Risk
|
28%
Low Risk
|
41%
Moderate Risk
|
54%
Moderate Risk
|
48%
Moderate Risk
|
51%
Moderate Risk
|
| JOB SCORE | 2.9/10 | 7.0/10 | 3.9/10 | 3.2/10 | 6.5/10 | 5.2/10 |
| POLLING |
49%
(Moderate Risk,
Based on 28 votes)
|
26%
(Low Risk,
Based on 519 votes)
|
50%
(Moderate Risk,
Based on 51 votes)
|
There hasn't been enough votes on this occupation yet
|
27%
(Low Risk,
Based on 34 votes)
|
50%
(Moderate Risk,
Based on 286 votes)
|
|
GROWTH
by year 2034
|
-10.5%
|
4.5%
|
-3.0%
|
-11.1%
|
10.1%
|
7.3%
|
| WAGES |
$46,480
or $22.34 per hour
|
$59,310
or $28.51 per hour
|
$51,990
or $24.99 per hour
|
$57,260
or $27.53 per hour
|
$52,240
or $25.11 per hour
|
$46,730
or $22.46 per hour
|
|
VOLUME
as of 2024
|
15,660
|
697,740
|
8,750
|
1,450
|
38,740
|
1,057,660
|
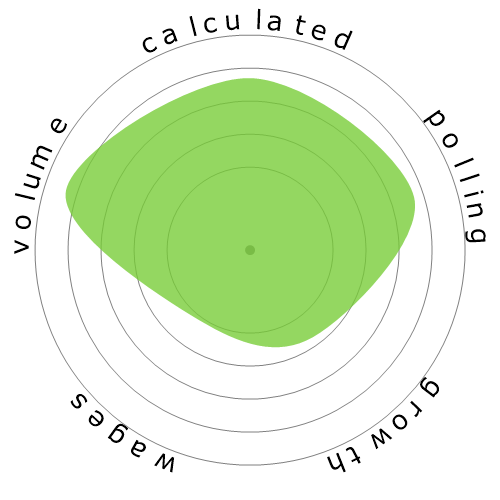
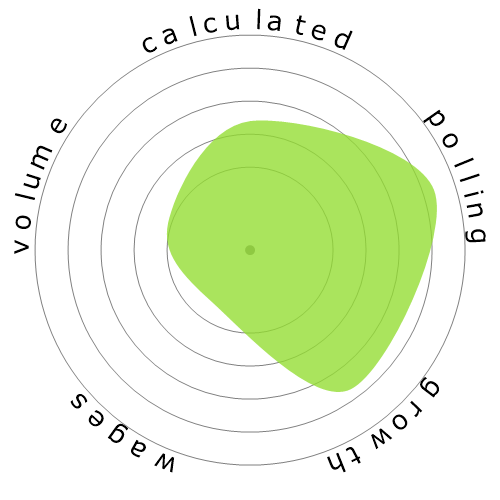
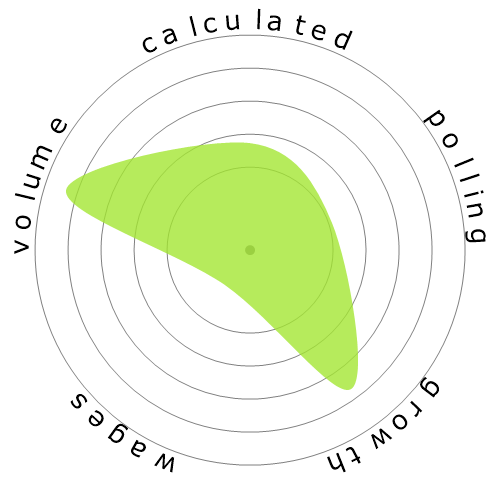
| SNOWFLAKE |

|
|

|

|
|
|
| DESCRIPTION | Help brickmasons, blockmasons, stonemasons, or tile and marble setters by performing duties requiring less skill. Duties include using, supplying, or holding materials or tools, and cleaning work area and equipment. | Construct, erect, install, or repair structures and fixtures made of wood and comparable materials, such as concrete forms; building frameworks, including partitions, joists, studding, and rafters; and wood stairways, window and door frames, and hardwood floors. May also install cabinets, siding, drywall, and batt or roll insulation. Includes brattice builders who build doors or brattices (ventilation walls or partitions) in underground passageways. | Build stone structures, such as piers, walls, and abutments. Lay walks, curbstones, or special types of masonry for vats, tanks, and floors. | Apply a mixture of cement, sand, pigment, or marble chips to floors, stairways, and cabinet fixtures to fashion durable and decorative surfaces. | Apply hard tile, stone, and comparable materials to walls, floors, ceilings, countertops, and roof decks. | Perform tasks involving physical labor at construction sites. May operate hand and power tools of all types: air hammers, earth tampers, cement mixers, small mechanical hoists, surveying and measuring equipment, and a variety of other equipment and instruments. May clean and prepare sites, dig trenches, set braces to support the sides of excavations, erect scaffolding, and clean up rubble, debris, and other waste materials. May assist other craft workers. |
Curious how automation and AI could affect your career? Our comparison tool lets you view two or more jobs side by side, helping you quickly spot differences in risk level, pay, growth, and popularity. All of this is based on a mix of academic research, user polling, and official labour data.
Each occupation shows a probability of automation. A higher score means machines and algorithms are more likely to take over the role in the future.
A quick summary of how a job performs overall — factoring in wages, growth, volume, and automation risk. It’s a handy way to see the bigger picture at a glance.
Thousands of visitors cast their votes on how “automatable” each job feels. These community insights are shown alongside the calculated probabilities.
See how fast each occupation is projected to grow and what people earn on average. High wages don’t always mean high security — automation risk still matters.
Explore how many people currently work in each occupation and in which year the data was recorded. Popularity can affect how disruptive automation will be for the wider economy.
Each snowflake visualises the balance between automation risk, wages, growth, and job volume. Bigger and greener areas mean stronger performance in that dimension.
Use this comparison page to research careers, guide students, or simply explore the future of work. All data is regularly updated to keep the results relevant.