Automation Risk
Each occupation shows a probability of automation. A higher score means machines and algorithms are more likely to take over the role in the future.
| SUMMARY |
9%
Minimal Risk
|
9%
Minimal Risk
|
19%
Minimal Risk
|
19%
Minimal Risk
|
10%
Minimal Risk
|
| JOB SCORE | 6.8/10 | 6.7/10 | 7.1/10 | 5.2/10 | 5.9/10 |
| POLLING |
18.9%
(Minimal Risk,
Based on 318 votes)
|
27%
(Low Risk,
Based on 26 votes)
|
17.2%
(Minimal Risk,
Based on 67 votes)
|
42%
(Moderate Risk,
Based on 83 votes)
|
38%
(Low Risk,
Based on 19 votes)
|
|
GROWTH
by year 2034
|
3.7%
|
2.7%
|
7.0%
|
-3.1%
|
2.4%
|
| WAGES |
$64,910
or $31.20 per hour
|
$95,770
or $46.04 per hour
|
$61,770
or $29.69 per hour
|
$97,200
or $46.73 per hour
|
$84,290
or $40.52 per hour
|
|
VOLUME
as of 2024
|
8,070
|
5,260
|
12,280
|
1,380
|
11,430
|
| SNOWFLAKE |
|

|

|

|

|
| DESCRIPTION | Study the origin, development, and behavior of human beings. May study the way of life, language, or physical characteristics of people in various parts of the world. May engage in systematic recovery and examination of material evidence, such as tools or pottery remaining from past human cultures, in order to determine the history, customs, and living habits of earlier civilizations. | Teach courses in anthropology or archeology. Includes both teachers primarily engaged in teaching and those who do a combination of teaching and research. | Administer collections, such as artwork, collectibles, historic items, or scientific specimens of museums or other institutions. May conduct instructional, research, or public service activities of institution. | Study the nature and use of areas of the Earth's surface, relating and interpreting interactions of physical and cultural phenomena. Conduct research on physical aspects of a region, including land forms, climates, soils, plants, and animals, and conduct research on the spatial implications of human activities within a given area, including social characteristics, economic activities, and political organization, as well as researching interdependence between regions at scales ranging from local to global. | Teach courses pertaining to the culture and development of an area, an ethnic group, or any other group, such as Latin American studies, women's studies, or urban affairs. Includes both teachers primarily engaged in teaching and those who do a combination of teaching and research. |
Curious how automation and AI could affect your career? Our comparison tool lets you view two or more jobs side by side, helping you quickly spot differences in risk level, pay, growth, and popularity. All of this is based on a mix of academic research, user polling, and official labour data.
Each occupation shows a probability of automation. A higher score means machines and algorithms are more likely to take over the role in the future.
A quick summary of how a job performs overall — factoring in wages, growth, volume, and automation risk. It’s a handy way to see the bigger picture at a glance.
Thousands of visitors cast their votes on how “automatable” each job feels. These community insights are shown alongside the calculated probabilities.
See how fast each occupation is projected to grow and what people earn on average. High wages don’t always mean high security — automation risk still matters.
Explore how many people currently work in each occupation and in which year the data was recorded. Popularity can affect how disruptive automation will be for the wider economy.
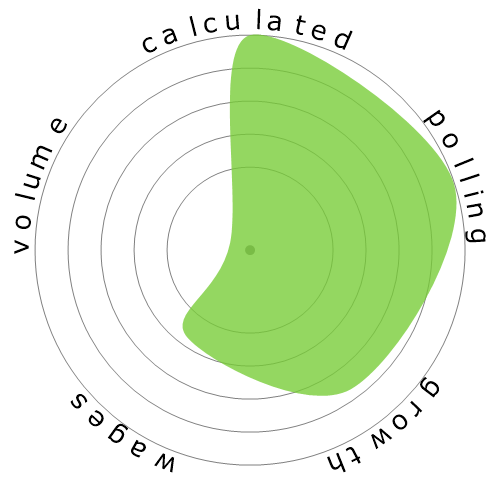
Each snowflake visualises the balance between automation risk, wages, growth, and job volume. Bigger and greener areas mean stronger performance in that dimension.
Use this comparison page to research careers, guide students, or simply explore the future of work. All data is regularly updated to keep the results relevant.