Automation Risk
Each occupation shows a probability of automation. A higher score means machines and algorithms are more likely to take over the role in the future.
| SUMMARY |
80%
High Risk
|
35%
Low Risk
|
66%
High Risk
|
46%
Moderate Risk
|
38%
Low Risk
|
54%
Moderate Risk
|
| JOB SCORE | 2.3/10 | 4.6/10 | 4.0/10 | 4.7/10 | 6.1/10 | 5.0/10 |
| POLLING |
62%
(High Risk,
Based on 19 votes)
|
There hasn't been enough votes on this occupation yet
|
There hasn't been enough votes on this occupation yet
|
42%
(Moderate Risk,
Based on 26 votes)
|
33%
(Low Risk,
Based on 103 votes)
|
40%
(Moderate Risk,
Based on 28 votes)
|
|
GROWTH
by year 2034
|
2.3%
|
3.5%
|
5.3%
|
4.1%
|
3.8%
|
4.2%
|
| WAGES |
$38,140
or $18.34 per hour
|
$48,120
or $23.13 per hour
|
$48,260
or $23.20 per hour
|
$56,020
or $26.93 per hour
|
$48,620
or $23.37 per hour
|
$58,140
or $27.95 per hour
|
|
VOLUME
as of 2024
|
7,220
|
33,530
|
1,520
|
20,880
|
1,531,700
|
82,900
|
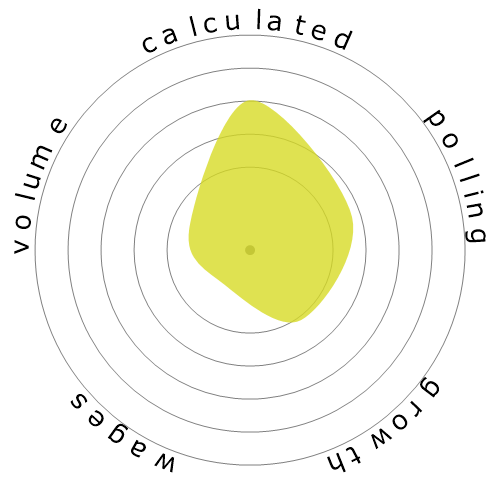
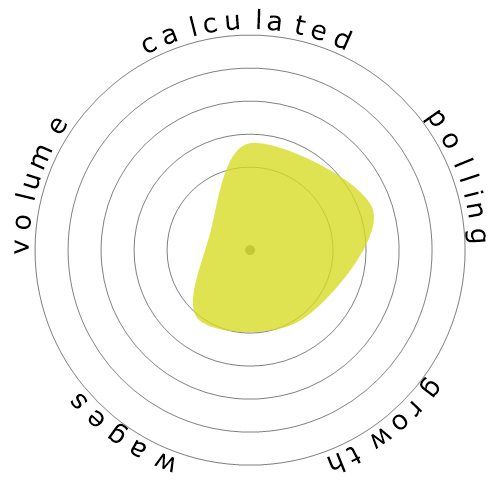
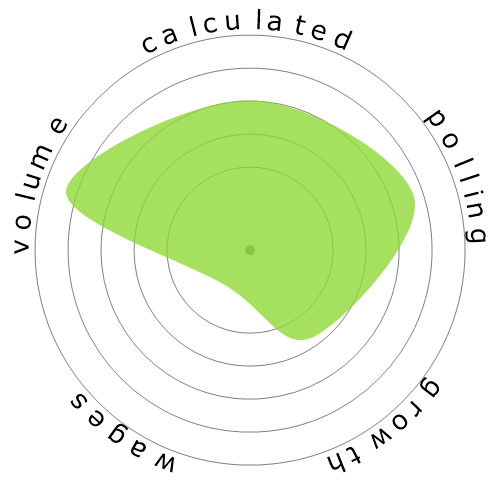
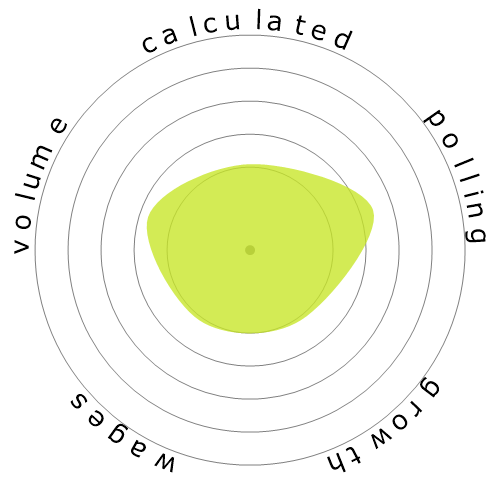
| SNOWFLAKE |

|
|

|
|
|
|
| DESCRIPTION | Help painters, paperhangers, plasterers, or stucco masons by performing duties requiring less skill. Duties include using, supplying, or holding materials or tools, and cleaning work area and equipment. | Perform a variety of activities to weatherize homes and make them more energy efficient. Duties include repairing windows, insulating ducts, and performing heating, ventilating, and air-conditioning (HVAC) work. May perform energy audits and advise clients on energy conservation measures. | Cover interior walls or ceilings of rooms with decorative wallpaper or fabric, or attach advertising posters on surfaces such as walls and billboards. May remove old materials or prepare surfaces to be papered. | Apply interior or exterior plaster, cement, stucco, or similar materials. May also set ornamental plaster. | Perform work involving the skills of two or more maintenance or craft occupations to keep machines, mechanical equipment, or the structure of a building in repair. Duties may involve pipe fitting; HVAC maintenance; insulating; welding; machining; carpentry; repairing electrical or mechanical equipment; installing, aligning, and balancing new equipment; and repairing buildings, floors, or stairs. | Apply plasterboard or other wallboard to ceilings or interior walls of buildings. Apply or mount acoustical tiles or blocks, strips, or sheets of shock-absorbing materials to ceilings and walls of buildings to reduce or reflect sound. Materials may be of decorative quality. Includes lathers who fasten wooden, metal, or rockboard lath to walls, ceilings, or partitions of buildings to provide support base for plaster, fireproofing, or acoustical material. |
Curious how automation and AI could affect your career? Our comparison tool lets you view two or more jobs side by side, helping you quickly spot differences in risk level, pay, growth, and popularity. All of this is based on a mix of academic research, user polling, and official labour data.
Each occupation shows a probability of automation. A higher score means machines and algorithms are more likely to take over the role in the future.
A quick summary of how a job performs overall — factoring in wages, growth, volume, and automation risk. It’s a handy way to see the bigger picture at a glance.
Thousands of visitors cast their votes on how “automatable” each job feels. These community insights are shown alongside the calculated probabilities.
See how fast each occupation is projected to grow and what people earn on average. High wages don’t always mean high security — automation risk still matters.
Explore how many people currently work in each occupation and in which year the data was recorded. Popularity can affect how disruptive automation will be for the wider economy.
Each snowflake visualises the balance between automation risk, wages, growth, and job volume. Bigger and greener areas mean stronger performance in that dimension.
Use this comparison page to research careers, guide students, or simply explore the future of work. All data is regularly updated to keep the results relevant.