Automation Risk
Each occupation shows a probability of automation. A higher score means machines and algorithms are more likely to take over the role in the future.
| SUMMARY |
69%
High Risk
|
24%
Low Risk
|
21%
Low Risk
|
50%
Moderate Risk
|
46%
Moderate Risk
|
60%
Moderate Risk
|
| JOB SCORE | 3.4/10 | 6.8/10 | 6.4/10 | 3.8/10 | 6.8/10 | 4.6/10 |
| POLLING |
There hasn't been enough votes on this occupation yet
|
There hasn't been enough votes on this occupation yet
|
34%
(Low Risk,
Based on 28 votes)
|
There hasn't been enough votes on this occupation yet
|
29%
(Low Risk,
Based on 49 votes)
|
53%
(Moderate Risk,
Based on 72 votes)
|
|
GROWTH
by year 2034
|
-0.4%
|
5.3%
|
8.5%
|
2.9%
|
5.8%
|
3.6%
|
| WAGES |
$52,550
or $25.26 per hour
|
$78,690
or $37.83 per hour
|
$58,440
or $28.09 per hour
|
$59,600
or $28.65 per hour
|
$63,980
or $30.76 per hour
|
$58,710
or $28.22 per hour
|
|
VOLUME
as of 2024
|
34,210
|
806,080
|
31,450
|
17,410
|
180,270
|
469,270
|
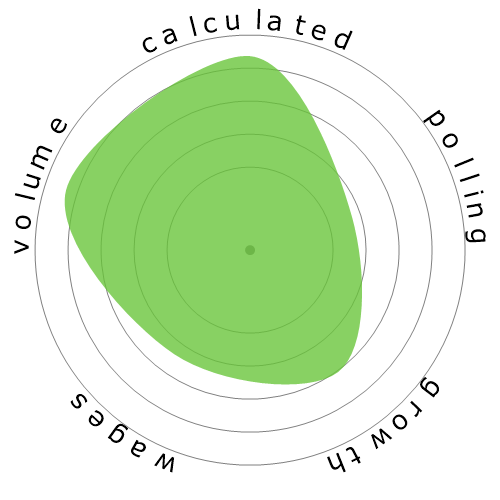
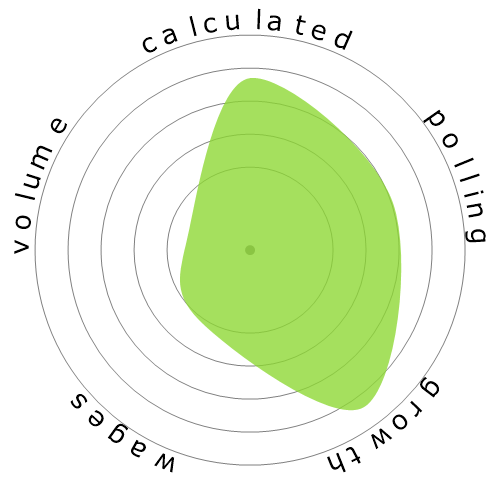
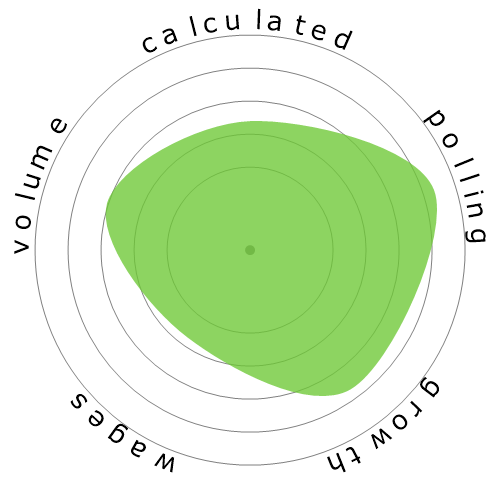
| SNOWFLAKE |

|
|
|

|
|

|
| DESCRIPTION | Operate or tend machinery at surface mining site, equipped with scoops, shovels, or buckets to excavate and load loose materials. | Directly supervise and coordinate activities of construction or extraction workers. | Collect data on work environments for analysis by occupational health and safety specialists. Implement and conduct evaluation of programs designed to limit chemical, physical, biological, and ergonomic risks to workers. | Operate a variety of drills such as rotary, churn, and pneumatic to tap subsurface water and salt deposits, to remove core samples during mineral exploration or soil testing, and to facilitate the use of explosives in mining or construction. Includes horizontal and earth boring machine operators. | Diagnose, adjust, repair, or overhaul mobile mechanical, hydraulic, and pneumatic equipment, such as cranes, bulldozers, graders, and conveyors, used in construction, logging, and mining. | Operate one or several types of power construction equipment, such as motor graders, bulldozers, scrapers, compressors, pumps, derricks, shovels, tractors, or front-end loaders to excavate, move, and grade earth, erect structures, or pour concrete or other hard surface pavement. May repair and maintain equipment in addition to other duties. |
Curious how automation and AI could affect your career? Our comparison tool lets you view two or more jobs side by side, helping you quickly spot differences in risk level, pay, growth, and popularity. All of this is based on a mix of academic research, user polling, and official labour data.
Each occupation shows a probability of automation. A higher score means machines and algorithms are more likely to take over the role in the future.
A quick summary of how a job performs overall — factoring in wages, growth, volume, and automation risk. It’s a handy way to see the bigger picture at a glance.
Thousands of visitors cast their votes on how “automatable” each job feels. These community insights are shown alongside the calculated probabilities.
See how fast each occupation is projected to grow and what people earn on average. High wages don’t always mean high security — automation risk still matters.
Explore how many people currently work in each occupation and in which year the data was recorded. Popularity can affect how disruptive automation will be for the wider economy.
Each snowflake visualises the balance between automation risk, wages, growth, and job volume. Bigger and greener areas mean stronger performance in that dimension.
Use this comparison page to research careers, guide students, or simply explore the future of work. All data is regularly updated to keep the results relevant.