Automation Risk
Each occupation shows a probability of automation. A higher score means machines and algorithms are more likely to take over the role in the future.
| SUMMARY |
46%
Moderate Risk
|
17%
Minimal Risk
|
21%
Low Risk
|
25%
Low Risk
|
28%
Low Risk
|
24%
Low Risk
|
| JOB SCORE | 3.6/10 | 5.8/10 | 5.9/10 | 5.0/10 | 4.1/10 | 5.1/10 |
| POLLING |
33%
(Low Risk,
Based on 33 votes)
|
There hasn't been enough votes on this occupation yet
|
26%
(Low Risk,
Based on 87 votes)
|
41%
(Moderate Risk,
Based on 24 votes)
|
There hasn't been enough votes on this occupation yet
|
There hasn't been enough votes on this occupation yet
|
|
GROWTH
by year 2034
|
-4.7%
|
14.6%
|
1.2%
|
2.5%
|
-3.2%
|
4.0%
|
| WAGES |
$43,680
or $21.00 per hour
|
$52,380
or $25.18 per hour
|
$70,660
or $33.97 per hour
|
$59,330
or $28.52 per hour
|
$54,310
or $26.11 per hour
|
$49,490
or $23.79 per hour
|
|
VOLUME
as of 2024
|
5,630
|
2,780
|
9,650
|
29,530
|
31,080
|
39,390
|
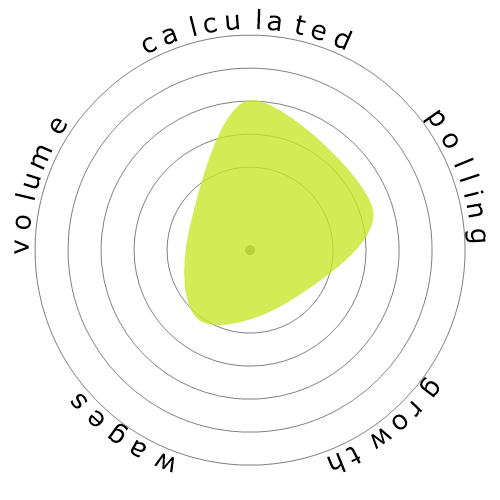
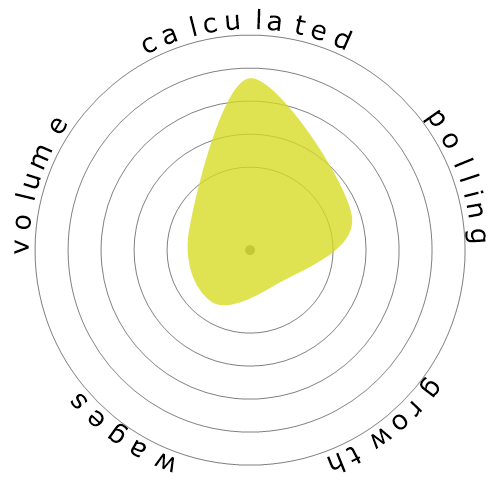
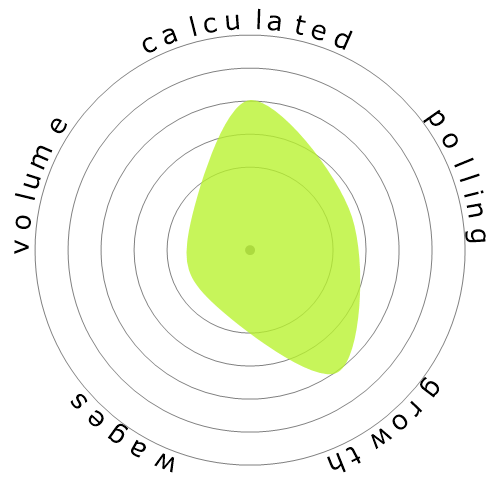
| SNOWFLAKE |

|

|

|
|
|
|
| DESCRIPTION | Under supervision, perform manual labor necessary to develop, maintain, or protect areas such as forests, forested areas, woodlands, wetlands, and rangelands through such activities as raising and transporting seedlings; combating insects, pests, and diseases harmful to plant life; and building structures to control water, erosion, and leaching of soil. Includes forester aides, seedling pullers, tree planters, and gatherers of nontimber forestry products such as pine straw. | Enforce fire regulations, inspect forest for fire hazards, and recommend forest fire prevention or control measures. May report forest fires and weather conditions. | Manage public and private forested lands for economic, recreational, and conservation purposes. May inventory the type, amount, and location of standing timber, appraise the timber's worth, negotiate the purchase, and draw up contracts for procurement. May determine how to conserve wildlife habitats, creek beds, water quality, and soil stability, and how best to comply with environmental regulations. May devise plans for planting and growing new trees, monitor trees for healthy growth, and determine optimal harvesting schedules. | Directly supervise and coordinate the activities of agricultural, forestry, aquacultural, and related workers. | Provide technical assistance regarding the conservation of soil, water, forests, or related natural resources. May compile data pertaining to size, content, condition, and other characteristics of forest tracts under the direction of foresters, or train and lead forest workers in forest propagation and fire prevention and suppression. May assist conservation scientists in managing, improving, and protecting rangelands and wildlife habitats. | Perform laboratory and field tests to monitor the environment and investigate sources of pollution, including those that affect health, under the direction of an environmental scientist, engineer, or other specialist. May collect samples of gases, soil, water, and other materials for testing. |
Curious how automation and AI could affect your career? Our comparison tool lets you view two or more jobs side by side, helping you quickly spot differences in risk level, pay, growth, and popularity. All of this is based on a mix of academic research, user polling, and official labour data.
Each occupation shows a probability of automation. A higher score means machines and algorithms are more likely to take over the role in the future.
A quick summary of how a job performs overall — factoring in wages, growth, volume, and automation risk. It’s a handy way to see the bigger picture at a glance.
Thousands of visitors cast their votes on how “automatable” each job feels. These community insights are shown alongside the calculated probabilities.
See how fast each occupation is projected to grow and what people earn on average. High wages don’t always mean high security — automation risk still matters.
Explore how many people currently work in each occupation and in which year the data was recorded. Popularity can affect how disruptive automation will be for the wider economy.
Each snowflake visualises the balance between automation risk, wages, growth, and job volume. Bigger and greener areas mean stronger performance in that dimension.
Use this comparison page to research careers, guide students, or simply explore the future of work. All data is regularly updated to keep the results relevant.