Automation Risk
Each occupation shows a probability of automation. A higher score means machines and algorithms are more likely to take over the role in the future.
| SUMMARY |
33%
Low Risk
|
29%
Low Risk
|
30%
Low Risk
|
37%
Low Risk
|
42%
Moderate Risk
|
| JOB SCORE | 3.7/10 | 5.5/10 | 5.6/10 | 5.2/10 | 4.8/10 |
| POLLING |
51%
(Moderate Risk,
Based on 82 votes)
|
41%
(Moderate Risk,
Based on 19 votes)
|
46%
(Moderate Risk,
Based on 110 votes)
|
There hasn't been enough votes on this occupation yet
|
There hasn't been enough votes on this occupation yet
|
|
GROWTH
by year 2034
|
2.9%
|
18.4%
|
12.5%
|
5.2%
|
19.8%
|
| WAGES |
$46,560
or $22.38 per hour
|
$61,560
or $29.59 per hour
|
$44,200
or $21.25 per hour
|
$48,790
or $23.45 per hour
|
$44,080
or $21.19 per hour
|
|
VOLUME
as of 2024
|
79,690
|
10,580
|
793,460
|
174,060
|
76,520
|
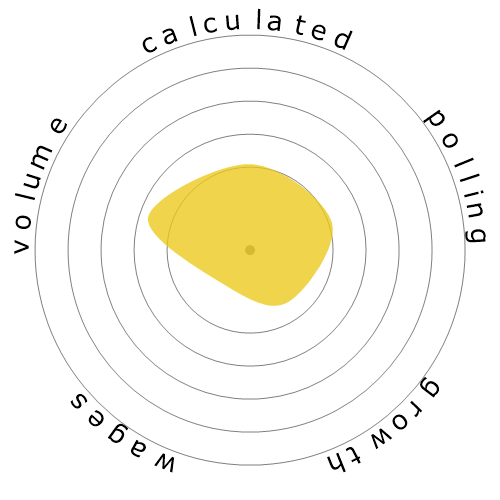
| SNOWFLAKE |
|

|

|

|

|
| DESCRIPTION | Design, measure, fit, and adapt lenses and frames for client according to written optical prescription or specification. Assist client with inserting, removing, and caring for contact lenses. Assist client with selecting frames. Measure customer for size of eyeglasses and coordinate frames with facial and eye measurements and optical prescription. Prepare work order for optical laboratory containing instructions for grinding and mounting lenses in frames. Verify exactness of finished lens spectacles. Adjust frame and lens position to fit client. May shape or reshape frames. Includes contact lens opticians. | Select and fit hearing aids for customers. Administer and interpret tests of hearing. Assess hearing instrument efficacy. Take ear impressions and prepare, design, and modify ear molds. | Perform administrative and certain clinical duties under the direction of a physician. Administrative duties may include scheduling appointments, maintaining medical records, billing, and coding information for insurance purposes. Clinical duties may include taking and recording vital signs and medical histories, preparing patients for examination, drawing blood, and administering medications as directed by physician. | Assist ophthalmologists by performing ophthalmic clinical functions and ophthalmic photography. Provide instruction and supervision to other ophthalmic personnel. Assist with minor surgical procedures, applying aseptic techniques and preparing instruments. May perform eye exams, administer eye medications, and instruct patients in care and use of corrective lenses. | Assist ophthalmologists by performing ophthalmic clinical functions. May administer eye exams, administer eye medications, and instruct the patient in care and use of corrective lenses. |
Curious how automation and AI could affect your career? Our comparison tool lets you view two or more jobs side by side, helping you quickly spot differences in risk level, pay, growth, and popularity. All of this is based on a mix of academic research, user polling, and official labour data.
Each occupation shows a probability of automation. A higher score means machines and algorithms are more likely to take over the role in the future.
A quick summary of how a job performs overall — factoring in wages, growth, volume, and automation risk. It’s a handy way to see the bigger picture at a glance.
Thousands of visitors cast their votes on how “automatable” each job feels. These community insights are shown alongside the calculated probabilities.
See how fast each occupation is projected to grow and what people earn on average. High wages don’t always mean high security — automation risk still matters.
Explore how many people currently work in each occupation and in which year the data was recorded. Popularity can affect how disruptive automation will be for the wider economy.
Each snowflake visualises the balance between automation risk, wages, growth, and job volume. Bigger and greener areas mean stronger performance in that dimension.
Use this comparison page to research careers, guide students, or simply explore the future of work. All data is regularly updated to keep the results relevant.