Automation Risk
Each occupation shows a probability of automation. A higher score means machines and algorithms are more likely to take over the role in the future.
| SUMMARY |
13%
Minimal Risk
|
4%
Minimal Risk
|
6%
Minimal Risk
|
13%
Minimal Risk
|
12%
Minimal Risk
|
| JOB SCORE | 9.0/10 | 6.7/10 | 5.6/10 | 7.5/10 | 6.6/10 |
| POLLING |
23%
(Low Risk,
Based on 761 votes)
|
23%
(Low Risk,
Based on 95 votes)
|
There hasn't been enough votes on this occupation yet
|
26%
(Low Risk,
Based on 104 votes)
|
41%
(Moderate Risk,
Based on 25 votes)
|
|
GROWTH
by year 2034
|
10.9%
|
3.3%
|
1.1%
|
11.1%
|
9.5%
|
| WAGES |
$101,020
or $48.56 per hour
|
$60,280
or $28.98 per hour
|
$67,430
or $32.42 per hour
|
$60,250
or $28.96 per hour
|
$58,160
or $27.96 per hour
|
|
VOLUME
as of 2024
|
248,630
|
15,060
|
39,350
|
28,950
|
8,110
|
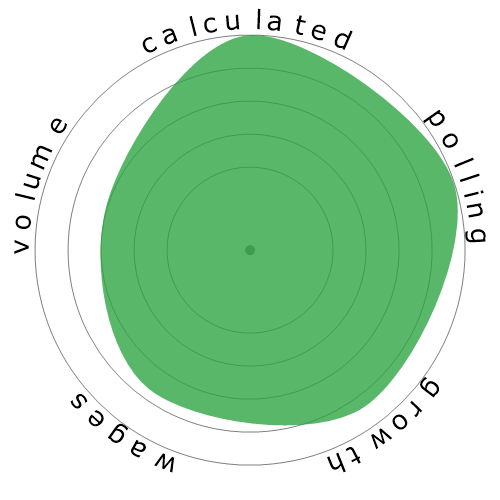
| SNOWFLAKE |
|

|

|

|

|
| DESCRIPTION | Assess, plan, organize, and participate in rehabilitative programs that improve mobility, relieve pain, increase strength, and improve or correct disabling conditions resulting from disease or injury. | Plan, direct, or coordinate medically-approved recreation programs for patients in hospitals, nursing homes, or other institutions. Activities include sports, trips, dramatics, social activities, and crafts. May assess a patient condition and recommend appropriate recreational activity. | Provide individualized physical education instruction or services to children, youth, or adults with exceptional physical needs due to gross motor developmental delays or other impairments. | Evaluate and treat musculoskeletal injuries or illnesses. Provide preventive, therapeutic, emergency, and rehabilitative care. | Assess, plan, or implement fitness programs that include exercise or physical activities such as those designed to improve cardiorespiratory function, body composition, muscular strength, muscular endurance, or flexibility. |
Curious how automation and AI could affect your career? Our comparison tool lets you view two or more jobs side by side, helping you quickly spot differences in risk level, pay, growth, and popularity. All of this is based on a mix of academic research, user polling, and official labour data.
Each occupation shows a probability of automation. A higher score means machines and algorithms are more likely to take over the role in the future.
A quick summary of how a job performs overall — factoring in wages, growth, volume, and automation risk. It’s a handy way to see the bigger picture at a glance.
Thousands of visitors cast their votes on how “automatable” each job feels. These community insights are shown alongside the calculated probabilities.
See how fast each occupation is projected to grow and what people earn on average. High wages don’t always mean high security — automation risk still matters.
Explore how many people currently work in each occupation and in which year the data was recorded. Popularity can affect how disruptive automation will be for the wider economy.
Each snowflake visualises the balance between automation risk, wages, growth, and job volume. Bigger and greener areas mean stronger performance in that dimension.
Use this comparison page to research careers, guide students, or simply explore the future of work. All data is regularly updated to keep the results relevant.