Automation Risk
Each occupation shows a probability of automation. A higher score means machines and algorithms are more likely to take over the role in the future.
| SUMMARY |
15%
Minimal Risk
|
17%
Minimal Risk
|
11%
Minimal Risk
|
20%
Low Risk
|
23%
Low Risk
|
| JOB SCORE | 6.2/10 | 6.7/10 | 6.9/10 | 7.4/10 | 6.4/10 |
| POLLING |
There hasn't been enough votes on this occupation yet
|
31%
(Low Risk,
Based on 62 votes)
|
There hasn't been enough votes on this occupation yet
|
26%
(Low Risk,
Based on 210 votes)
|
There hasn't been enough votes on this occupation yet
|
|
GROWTH
by year 2034
|
4.9%
|
8.7%
|
7.7%
|
4.8%
|
4.9%
|
| WAGES |
$83,480
or $40.13 per hour
|
$96,310
or $46.30 per hour
|
$77,180
or $37.10 per hour
|
$69,780
or $33.55 per hour
|
$83,480
or $40.13 per hour
|
|
VOLUME
as of 2024
|
145,270
|
14,220
|
36,700
|
280,590
|
145,270
|
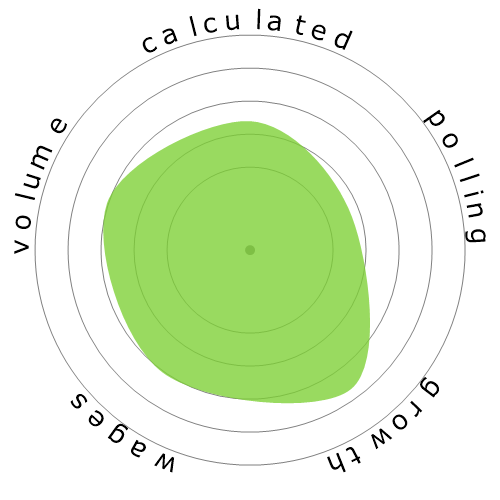
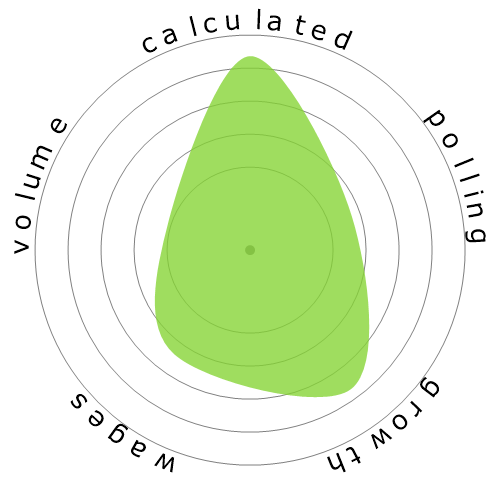
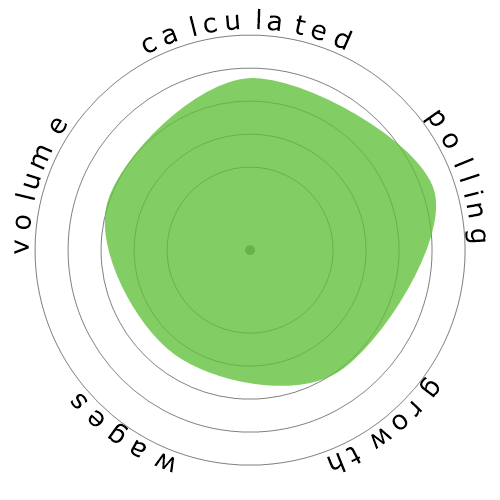
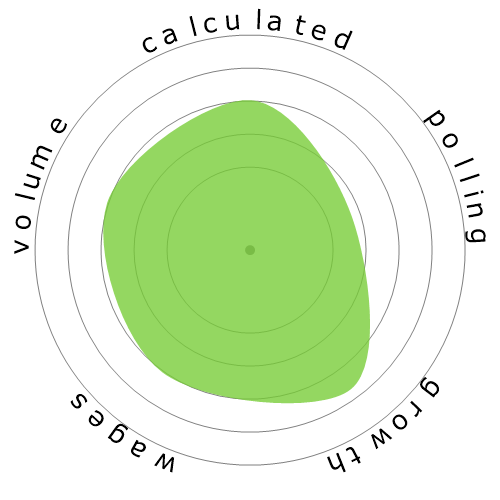
| SNOWFLAKE |
|

|
|
|
|
| DESCRIPTION | Audition and interview performers to select most appropriate talent for parts in stage, television, radio, or motion picture productions. | Represent and promote artists, performers, and athletes in dealings with current or prospective employers. May handle contract negotiation and other business matters for clients. | Plan, direct, or coordinate entertainment and recreational activities and operations of a recreational facility, including cruise ships and parks. | Promote or create an intended public image for individuals, groups, or organizations. May write or select material for release to various communications media. May specialize in using social media. | Direct and coordinate activities of personnel engaged in preparation of radio or television station program schedules and programs, such as sports or news. |
Curious how automation and AI could affect your career? Our comparison tool lets you view two or more jobs side by side, helping you quickly spot differences in risk level, pay, growth, and popularity. All of this is based on a mix of academic research, user polling, and official labour data.
Each occupation shows a probability of automation. A higher score means machines and algorithms are more likely to take over the role in the future.
A quick summary of how a job performs overall — factoring in wages, growth, volume, and automation risk. It’s a handy way to see the bigger picture at a glance.
Thousands of visitors cast their votes on how “automatable” each job feels. These community insights are shown alongside the calculated probabilities.
See how fast each occupation is projected to grow and what people earn on average. High wages don’t always mean high security — automation risk still matters.
Explore how many people currently work in each occupation and in which year the data was recorded. Popularity can affect how disruptive automation will be for the wider economy.
Each snowflake visualises the balance between automation risk, wages, growth, and job volume. Bigger and greener areas mean stronger performance in that dimension.
Use this comparison page to research careers, guide students, or simply explore the future of work. All data is regularly updated to keep the results relevant.