Automation Risk
Each occupation shows a probability of automation. A higher score means machines and algorithms are more likely to take over the role in the future.
| SUMMARY |
9%
Minimal Risk
|
10%
Minimal Risk
|
7%
Minimal Risk
|
10%
Minimal Risk
|
10%
Minimal Risk
|
| JOB SCORE | 8.3/10 | 9.1/10 | 8.5/10 | 8.5/10 | 7.5/10 |
| POLLING |
16.0%
(Minimal Risk,
Based on 1,242 votes)
|
29%
(Low Risk,
Based on 299 votes)
|
21%
(Low Risk,
Based on 51 votes)
|
35%
(Low Risk,
Based on 126 votes)
|
43%
(Moderate Risk,
Based on 17 votes)
|
|
GROWTH
by year 2034
|
4.9%
|
40.1%
|
4.9%
|
23.2%
|
16.8%
|
| WAGES |
$93,600
or $45.00 per hour
|
$129,210
or $62.12 per hour
|
$93,600
or $45.00 per hour
|
$117,960
or $56.71 per hour
|
$79,940
or $38.43 per hour
|
|
VOLUME
as of 2024
|
3,282,010
|
307,390
|
3,282,010
|
565,840
|
74,250
|
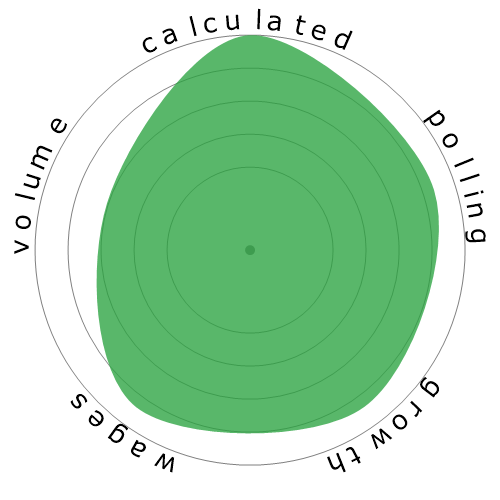
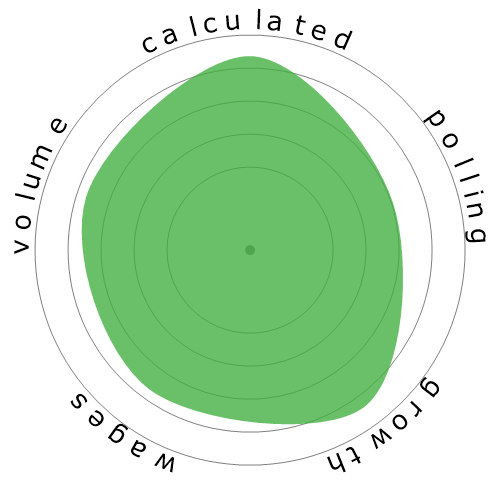
| SNOWFLAKE |

|
|

|
|

|
| DESCRIPTION | Assess patient health problems and needs, develop and implement nursing care plans, and maintain medical records. Administer nursing care to ill, injured, convalescent, or disabled patients. May advise patients on health maintenance and disease prevention or provide case management. Licensing or registration required. | Diagnose and treat acute, episodic, or chronic illness, independently or as part of a healthcare team. May focus on health promotion and disease prevention. May order, perform, or interpret diagnostic tests such as lab work and x rays. May prescribe medication. Must be registered nurses who have specialized graduate education. | Provide specialized nursing care for patients in critical or coronary care units. | Plan, direct, or coordinate medical and health services in hospitals, clinics, managed care organizations, public health agencies, or similar organizations. | Demonstrate and teach patient care in classroom and clinical units to nursing students. Includes both teachers primarily engaged in teaching and those who do a combination of teaching and research. |
Curious how automation and AI could affect your career? Our comparison tool lets you view two or more jobs side by side, helping you quickly spot differences in risk level, pay, growth, and popularity. All of this is based on a mix of academic research, user polling, and official labour data.
Each occupation shows a probability of automation. A higher score means machines and algorithms are more likely to take over the role in the future.
A quick summary of how a job performs overall — factoring in wages, growth, volume, and automation risk. It’s a handy way to see the bigger picture at a glance.
Thousands of visitors cast their votes on how “automatable” each job feels. These community insights are shown alongside the calculated probabilities.
See how fast each occupation is projected to grow and what people earn on average. High wages don’t always mean high security — automation risk still matters.
Explore how many people currently work in each occupation and in which year the data was recorded. Popularity can affect how disruptive automation will be for the wider economy.
Each snowflake visualises the balance between automation risk, wages, growth, and job volume. Bigger and greener areas mean stronger performance in that dimension.
Use this comparison page to research careers, guide students, or simply explore the future of work. All data is regularly updated to keep the results relevant.