Automation Risk
Each occupation shows a probability of automation. A higher score means machines and algorithms are more likely to take over the role in the future.
| SUMMARY |
24%
Low Risk
|
18%
Minimal Risk
|
21%
Low Risk
|
20%
Low Risk
|
19%
Minimal Risk
|
| JOB SCORE | 5.1/10 | 6.8/10 | 6.4/10 | 7.0/10 | 8.0/10 |
| POLLING |
There hasn't been enough votes on this occupation yet
|
There hasn't been enough votes on this occupation yet
|
34%
(Low Risk,
Based on 28 votes)
|
28%
(Low Risk,
Based on 102 votes)
|
33%
(Low Risk,
Based on 69 votes)
|
|
GROWTH
by year 2034
|
4.0%
|
4.4%
|
8.5%
|
4.4%
|
12.5%
|
| WAGES |
$49,490
or $23.79 per hour
|
$80,060
or $38.49 per hour
|
$58,440
or $28.09 per hour
|
$80,060
or $38.49 per hour
|
$83,910
or $40.34 per hour
|
|
VOLUME
as of 2024
|
39,390
|
84,930
|
31,450
|
84,930
|
128,430
|
| SNOWFLAKE |

|
|

|

|
|
| DESCRIPTION | Perform laboratory and field tests to monitor the environment and investigate sources of pollution, including those that affect health, under the direction of an environmental scientist, engineer, or other specialist. May collect samples of gases, soil, water, and other materials for testing. | Collaborate with field and biology staff to oversee the implementation of restoration projects and to develop new products. Process and synthesize complex scientific data into practical strategies for restoration, monitoring or management. | Collect data on work environments for analysis by occupational health and safety specialists. Implement and conduct evaluation of programs designed to limit chemical, physical, biological, and ergonomic risks to workers. | Conduct research or perform investigation for the purpose of identifying, abating, or eliminating sources of pollutants or hazards that affect either the environment or public health. Using knowledge of various scientific disciplines, may collect, synthesize, study, report, and recommend action based on data derived from measurements or observations of air, food, soil, water, and other sources. | Review, evaluate, and analyze work environments and design programs and procedures to control, eliminate, and prevent disease or injury caused by chemical, physical, and biological agents or ergonomic factors. May conduct inspections and enforce adherence to laws and regulations governing the health and safety of individuals. May be employed in the public or private sector. |
Curious how automation and AI could affect your career? Our comparison tool lets you view two or more jobs side by side, helping you quickly spot differences in risk level, pay, growth, and popularity. All of this is based on a mix of academic research, user polling, and official labour data.
Each occupation shows a probability of automation. A higher score means machines and algorithms are more likely to take over the role in the future.
A quick summary of how a job performs overall — factoring in wages, growth, volume, and automation risk. It’s a handy way to see the bigger picture at a glance.
Thousands of visitors cast their votes on how “automatable” each job feels. These community insights are shown alongside the calculated probabilities.
See how fast each occupation is projected to grow and what people earn on average. High wages don’t always mean high security — automation risk still matters.
Explore how many people currently work in each occupation and in which year the data was recorded. Popularity can affect how disruptive automation will be for the wider economy.
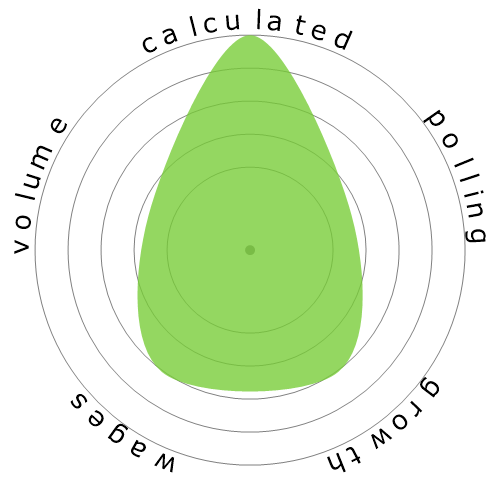
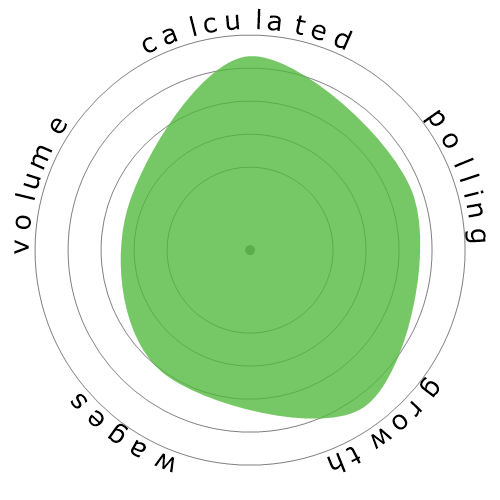
Each snowflake visualises the balance between automation risk, wages, growth, and job volume. Bigger and greener areas mean stronger performance in that dimension.
Use this comparison page to research careers, guide students, or simply explore the future of work. All data is regularly updated to keep the results relevant.