Automation Risk
Each occupation shows a probability of automation. A higher score means machines and algorithms are more likely to take over the role in the future.
| SUMMARY |
10%
Minimal Risk
|
10%
Minimal Risk
|
19%
Minimal Risk
|
19%
Minimal Risk
|
19%
Minimal Risk
|
| JOB SCORE | 5.6/10 | 6.9/10 | 6.7/10 | 6.1/10 | 7.0/10 |
| POLLING |
There hasn't been enough votes on this occupation yet
|
40%
(Moderate Risk,
Based on 18 votes)
|
31%
(Low Risk,
Based on 192 votes)
|
38%
(Low Risk,
Based on 26 votes)
|
34%
(Low Risk,
Based on 42 votes)
|
|
GROWTH
by year 2034
|
2.9%
|
3.7%
|
3.2%
|
1.3%
|
3.0%
|
| WAGES |
$87,710
or $42.16 per hour
|
$161,180
or $77.48 per hour
|
$99,240
or $47.71 per hour
|
$74,720
or $35.92 per hour
|
$81,270
or $39.07 per hour
|
|
VOLUME
as of 2024
|
7,130
|
100,870
|
22,510
|
210,850
|
1,128,200
|
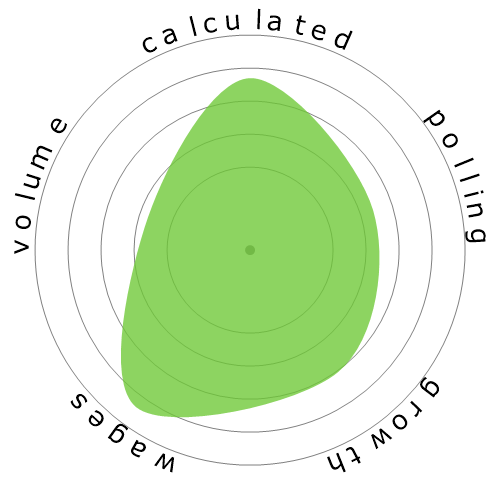
| SNOWFLAKE |

|
|

|

|

|
| DESCRIPTION | Teach courses in environmental science. Includes both teachers primarily engaged in teaching and those who do a combination of teaching and research. | Plan, direct, or coordinate activities in such fields as life sciences, physical sciences, mathematics, statistics, and research and development in these fields. | Study the composition, structure, and other physical aspects of the Earth. May use geological, physics, and mathematics knowledge in exploration for oil, gas, minerals, or underground water; or in waste disposal, land reclamation, or other environmental problems. May study the Earth's internal composition, atmospheres, and oceans, and its magnetic, electrical, and gravitational forces. Includes mineralogists, paleontologists, stratigraphers, geodesists, and seismologists. | Develop instructional material, coordinate educational content, and incorporate current technology into instruction in order to provide guidelines to educators and instructors for developing curricula and conducting courses. May train and coach teachers. Includes educational consultants and specialists, and instructional material directors. | Address organizational sustainability issues, such as waste stream management, green building practices, and green procurement plans. |
Curious how automation and AI could affect your career? Our comparison tool lets you view two or more jobs side by side, helping you quickly spot differences in risk level, pay, growth, and popularity. All of this is based on a mix of academic research, user polling, and official labour data.
Each occupation shows a probability of automation. A higher score means machines and algorithms are more likely to take over the role in the future.
A quick summary of how a job performs overall — factoring in wages, growth, volume, and automation risk. It’s a handy way to see the bigger picture at a glance.
Thousands of visitors cast their votes on how “automatable” each job feels. These community insights are shown alongside the calculated probabilities.
See how fast each occupation is projected to grow and what people earn on average. High wages don’t always mean high security — automation risk still matters.
Explore how many people currently work in each occupation and in which year the data was recorded. Popularity can affect how disruptive automation will be for the wider economy.
Each snowflake visualises the balance between automation risk, wages, growth, and job volume. Bigger and greener areas mean stronger performance in that dimension.
Use this comparison page to research careers, guide students, or simply explore the future of work. All data is regularly updated to keep the results relevant.