Automation Risk
Each occupation shows a probability of automation. A higher score means machines and algorithms are more likely to take over the role in the future.
| SUMMARY |
17%
Minimal Risk
|
11%
Minimal Risk
|
22%
Low Risk
|
17%
Minimal Risk
|
15%
Minimal Risk
|
| JOB SCORE | 6.7/10 | 7.9/10 | 5.6/10 | 6.7/10 | 6.2/10 |
| POLLING |
31%
(Low Risk,
Based on 62 votes)
|
37%
(Low Risk,
Based on 609 votes)
|
38%
(Low Risk,
Based on 80 votes)
|
30%
(Low Risk,
Based on 15 votes)
|
There hasn't been enough votes on this occupation yet
|
|
GROWTH
by year 2034
|
8.7%
|
4.7%
|
-2.2%
|
4.2%
|
4.9%
|
| WAGES |
$96,310
or $46.30 per hour
|
$138,060
or $66.37 per hour
|
$126,960
or $61.03 per hour
|
$123,480
or $59.36 per hour
|
$83,480
or $40.13 per hour
|
|
VOLUME
as of 2024
|
14,220
|
603,710
|
21,100
|
36,920
|
145,270
|
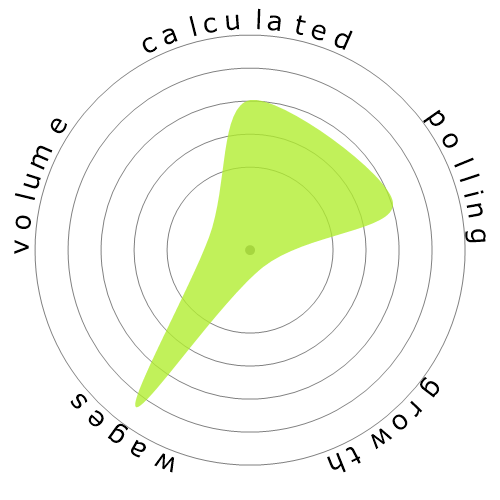
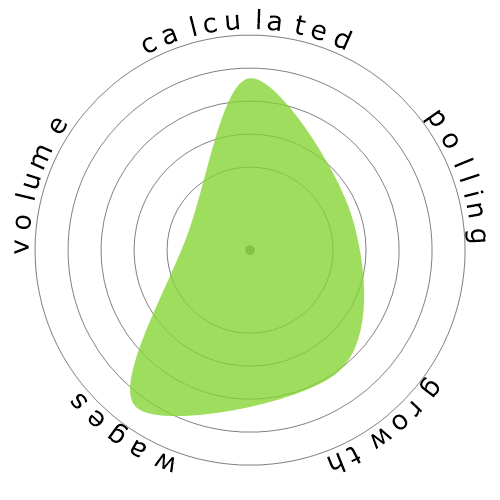
| SNOWFLAKE |

|

|
|
|

|
| DESCRIPTION | Represent and promote artists, performers, and athletes in dealings with current or prospective employers. May handle contract negotiation and other business matters for clients. | Plan, direct, or coordinate the actual distribution or movement of a product or service to the customer. Coordinate sales distribution by establishing sales territories, quotas, and goals and establish training programs for sales representatives. Analyze sales statistics gathered by staff to determine sales potential and inventory requirements and monitor the preferences of customers. | Plan, direct, or coordinate advertising policies and programs or produce collateral materials, such as posters, contests, coupons, or giveaways, to create extra interest in the purchase of a product or service for a department, an entire organization, or on an account basis. | Plan, direct, or coordinate activities to solicit and maintain funds for special projects or nonprofit organizations. | Audition and interview performers to select most appropriate talent for parts in stage, television, radio, or motion picture productions. |
Curious how automation and AI could affect your career? Our comparison tool lets you view two or more jobs side by side, helping you quickly spot differences in risk level, pay, growth, and popularity. All of this is based on a mix of academic research, user polling, and official labour data.
Each occupation shows a probability of automation. A higher score means machines and algorithms are more likely to take over the role in the future.
A quick summary of how a job performs overall — factoring in wages, growth, volume, and automation risk. It’s a handy way to see the bigger picture at a glance.
Thousands of visitors cast their votes on how “automatable” each job feels. These community insights are shown alongside the calculated probabilities.
See how fast each occupation is projected to grow and what people earn on average. High wages don’t always mean high security — automation risk still matters.
Explore how many people currently work in each occupation and in which year the data was recorded. Popularity can affect how disruptive automation will be for the wider economy.
Each snowflake visualises the balance between automation risk, wages, growth, and job volume. Bigger and greener areas mean stronger performance in that dimension.
Use this comparison page to research careers, guide students, or simply explore the future of work. All data is regularly updated to keep the results relevant.