Automation Risk
Each occupation shows a probability of automation. A higher score means machines and algorithms are more likely to take over the role in the future.
| SUMMARY |
87%
Imminent Risk
|
46%
Moderate Risk
|
25%
Low Risk
|
51%
Moderate Risk
|
21%
Low Risk
|
58%
Moderate Risk
|
| JOB SCORE | 1.6/10 | 3.6/10 | 5.0/10 | 4.5/10 | 6.4/10 | 3.6/10 |
| POLLING |
56%
(Moderate Risk,
Based on 24 votes)
|
33%
(Low Risk,
Based on 33 votes)
|
41%
(Moderate Risk,
Based on 24 votes)
|
39%
(Low Risk,
Based on 77 votes)
|
34%
(Low Risk,
Based on 28 votes)
|
43%
(Moderate Risk,
Based on 172 votes)
|
|
GROWTH
by year 2034
|
-7.3%
|
-4.7%
|
2.5%
|
3.3%
|
8.5%
|
3.6%
|
| WAGES |
$53,900
or $25.91 per hour
|
$43,680
or $21.00 per hour
|
$59,330
or $28.52 per hour
|
$50,430
or $24.24 per hour
|
$58,440
or $28.09 per hour
|
$38,090
or $18.31 per hour
|
|
VOLUME
as of 2024
|
4,110
|
5,630
|
29,530
|
47,870
|
31,450
|
943,430
|
| SNOWFLAKE |

|

|
|
|
|
|
| DESCRIPTION | Use axes or chainsaws to fell trees using knowledge of tree characteristics and cutting techniques to control direction of fall and minimize tree damage. | Under supervision, perform manual labor necessary to develop, maintain, or protect areas such as forests, forested areas, woodlands, wetlands, and rangelands through such activities as raising and transporting seedlings; combating insects, pests, and diseases harmful to plant life; and building structures to control water, erosion, and leaching of soil. Includes forester aides, seedling pullers, tree planters, and gatherers of nontimber forestry products such as pine straw. | Directly supervise and coordinate the activities of agricultural, forestry, aquacultural, and related workers. | Using sophisticated climbing and rigging techniques, cut away dead or excess branches from trees or shrubs to maintain right-of-way for roads, sidewalks, or utilities, or to improve appearance, health, and value of tree. Prune or treat trees or shrubs using handsaws, hand pruners, clippers, and power pruners. Works off the ground in the tree canopy and may use truck-mounted lifts. | Collect data on work environments for analysis by occupational health and safety specialists. Implement and conduct evaluation of programs designed to limit chemical, physical, biological, and ergonomic risks to workers. | Landscape or maintain grounds of property using hand or power tools or equipment. Workers typically perform a variety of tasks, which may include any combination of the following: sod laying, mowing, trimming, planting, watering, fertilizing, digging, raking, sprinkler installation, and installation of mortarless segmental concrete masonry wall units. |
Curious how automation and AI could affect your career? Our comparison tool lets you view two or more jobs side by side, helping you quickly spot differences in risk level, pay, growth, and popularity. All of this is based on a mix of academic research, user polling, and official labour data.
Each occupation shows a probability of automation. A higher score means machines and algorithms are more likely to take over the role in the future.
A quick summary of how a job performs overall — factoring in wages, growth, volume, and automation risk. It’s a handy way to see the bigger picture at a glance.
Thousands of visitors cast their votes on how “automatable” each job feels. These community insights are shown alongside the calculated probabilities.
See how fast each occupation is projected to grow and what people earn on average. High wages don’t always mean high security — automation risk still matters.
Explore how many people currently work in each occupation and in which year the data was recorded. Popularity can affect how disruptive automation will be for the wider economy.
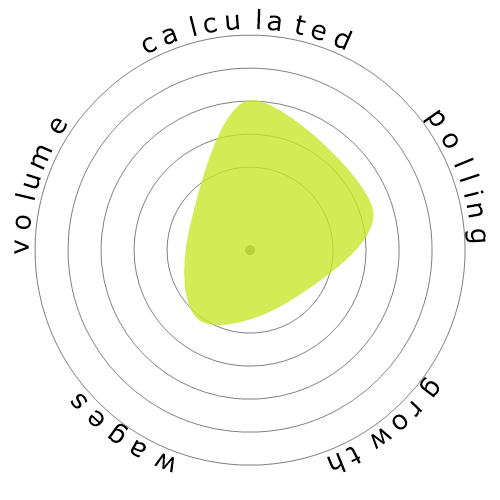
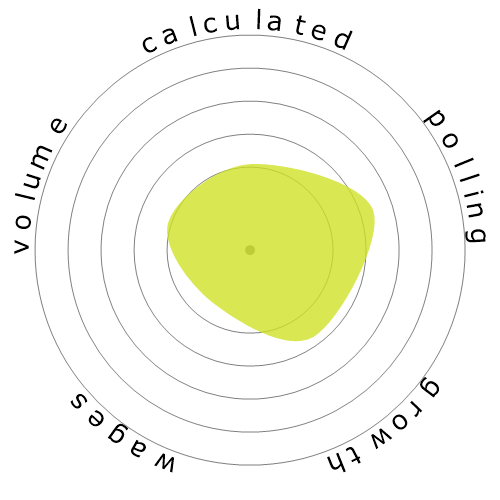
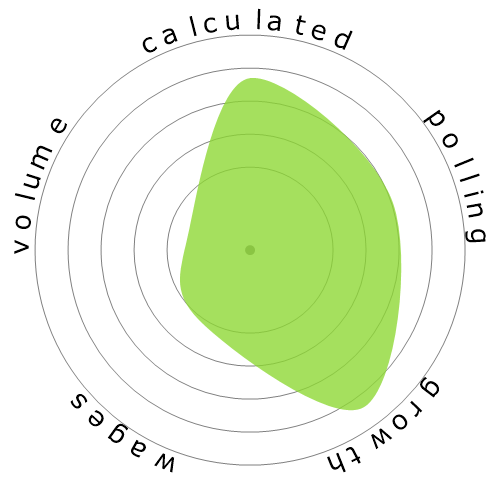
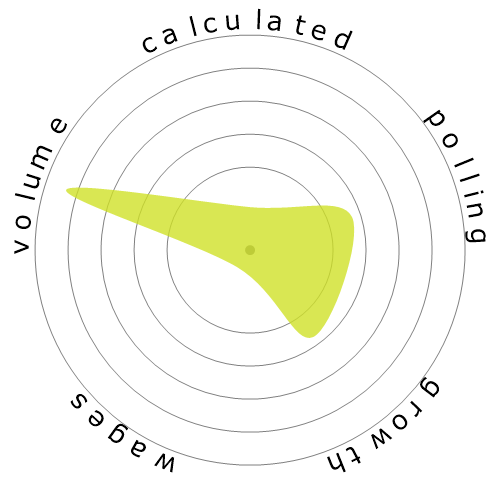
Each snowflake visualises the balance between automation risk, wages, growth, and job volume. Bigger and greener areas mean stronger performance in that dimension.
Use this comparison page to research careers, guide students, or simply explore the future of work. All data is regularly updated to keep the results relevant.