Automation Risk
Each occupation shows a probability of automation. A higher score means machines and algorithms are more likely to take over the role in the future.
| SUMMARY |
19%
Minimal Risk
|
19%
Minimal Risk
|
18%
Minimal Risk
|
20%
Minimal Risk
|
22%
Low Risk
|
| JOB SCORE | 5.8/10 | 8.0/10 | 7.4/10 | 7.0/10 | 6.2/10 |
| POLLING |
40%
(Low Risk,
Based on 36 votes)
|
33%
(Low Risk,
Based on 35 votes)
|
25%
(Low Risk,
Based on 290 votes)
|
49%
(Moderate Risk,
Based on 25 votes)
|
44%
(Moderate Risk,
Based on 533 votes)
|
|
GROWTH
by year 2034
|
-1.7%
|
5.0%
|
3.4%
|
16.7%
|
8.5%
|
| WAGES |
$100,340
or $48.24 per hour
|
$99,590
or $47.88 per hour
|
$83,720
or $40.25 per hour
|
$80,880
or $38.88 per hour
|
$103,300
or $49.66 per hour
|
|
VOLUME
as of 2024
|
36,970
|
355,410
|
43,040
|
235,640
|
29,800
|
| SNOWFLAKE |

|
|

|
|
|
| DESCRIPTION | Prepare studies for proposed transportation projects. Gather, compile, and analyze data. Study the use and operation of transportation systems. Develop transportation models or simulations. | Develop plans for surface transportation projects, according to established engineering standards and state or federal construction policy. Prepare designs, specifications, or estimates for transportation facilities. Plan modifications of existing streets, highways, or freeways to improve traffic flow. | Develop comprehensive plans and programs for use of land and physical facilities of jurisdictions, such as towns, cities, counties, and metropolitan areas. | Design or analyze operational solutions for projects such as transportation optimization, network modeling, process and methods analysis, cost containment, capacity enhancement, routing and shipment optimization, or information management. | Develop or apply mathematical or statistical theory and methods to collect, organize, interpret, and summarize numerical data to provide usable information. May specialize in fields such as biostatistics, agricultural statistics, business statistics, or economic statistics. Includes mathematical and survey statisticians. |
Curious how automation and AI could affect your career? Our comparison tool lets you view two or more jobs side by side, helping you quickly spot differences in risk level, pay, growth, and popularity. All of this is based on a mix of academic research, user polling, and official labour data.
Each occupation shows a probability of automation. A higher score means machines and algorithms are more likely to take over the role in the future.
A quick summary of how a job performs overall — factoring in wages, growth, volume, and automation risk. It’s a handy way to see the bigger picture at a glance.
Thousands of visitors cast their votes on how “automatable” each job feels. These community insights are shown alongside the calculated probabilities.
See how fast each occupation is projected to grow and what people earn on average. High wages don’t always mean high security — automation risk still matters.
Explore how many people currently work in each occupation and in which year the data was recorded. Popularity can affect how disruptive automation will be for the wider economy.
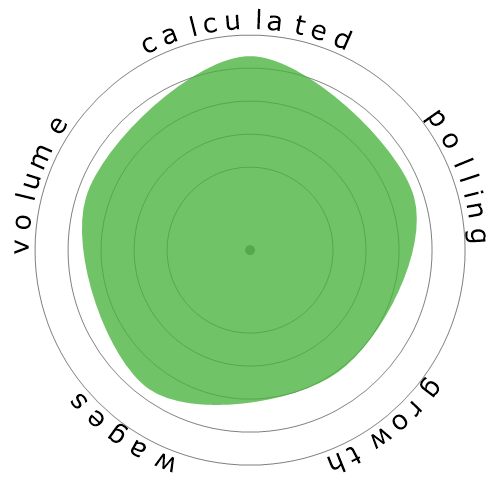
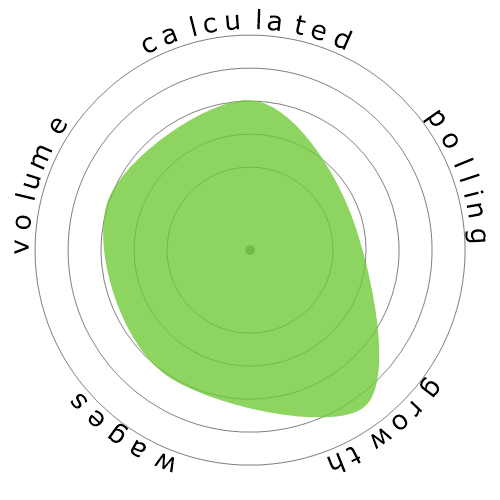
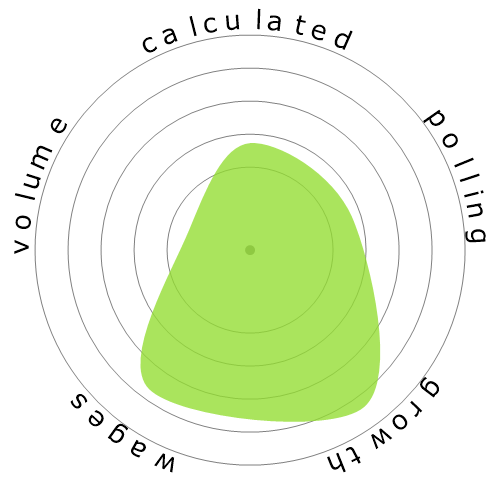
Each snowflake visualises the balance between automation risk, wages, growth, and job volume. Bigger and greener areas mean stronger performance in that dimension.
Use this comparison page to research careers, guide students, or simply explore the future of work. All data is regularly updated to keep the results relevant.