Automation Risk
Each occupation shows a probability of automation. A higher score means machines and algorithms are more likely to take over the role in the future.
| SUMMARY |
40%
Moderate Risk
|
23%
Low Risk
|
23%
Low Risk
|
23%
Low Risk
|
31%
Low Risk
|
32%
Low Risk
|
| JOB SCORE | 3.3/10 | 6.9/10 | 6.2/10 | 6.5/10 | 5.5/10 | 4.0/10 |
| POLLING |
50%
(Moderate Risk,
Based on 43 votes)
|
31%
(Low Risk,
Based on 143 votes)
|
36%
(Low Risk,
Based on 123 votes)
|
24%
(Low Risk,
Based on 36 votes)
|
There hasn't been enough votes on this occupation yet
|
53%
(Moderate Risk,
Based on 110 votes)
|
|
GROWTH
by year 2034
|
2.3%
|
4.8%
|
3.6%
|
3.4%
|
6.7%
|
8.1%
|
| WAGES |
$37,320
or $17.94 per hour
|
$59,440
or $28.57 per hour
|
$66,700
or $32.06 per hour
|
$68,130
or $32.75 per hour
|
$47,080
or $22.63 per hour
|
$36,660
or $17.62 per hour
|
|
VOLUME
as of 2024
|
44,200
|
134,670
|
296,640
|
41,350
|
107,060
|
49,010
|
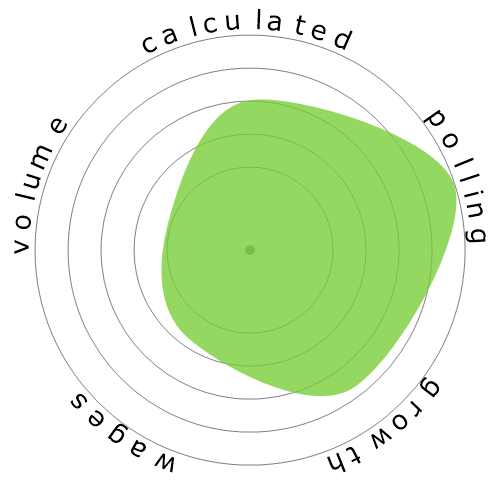
| SNOWFLAKE |

|

|

|
|

|

|
| DESCRIPTION | Assist patrons at hotel, apartment, or office building with personal services. May take messages; arrange or give advice on transportation, business services, or entertainment; or monitor guest requests for housekeeping and maintenance. | Coordinate activities of staff, convention personnel, or clients to make arrangements for group meetings, events, or conventions. | Plan, direct, or coordinate the selling, buying, leasing, or governance activities of commercial, industrial, or residential real estate properties. Includes managers of homeowner and condominium associations, rented or leased housing units, buildings, or land (including rights-of-way). | Plan, direct, or coordinate activities of an organization or department that provides lodging and other accommodations. | Supervise and coordinate activities of personal service workers. | Escort individuals or groups on sightseeing tours or through places of interest, such as industrial establishments, public buildings, and art galleries. |
Curious how automation and AI could affect your career? Our comparison tool lets you view two or more jobs side by side, helping you quickly spot differences in risk level, pay, growth, and popularity. All of this is based on a mix of academic research, user polling, and official labour data.
Each occupation shows a probability of automation. A higher score means machines and algorithms are more likely to take over the role in the future.
A quick summary of how a job performs overall — factoring in wages, growth, volume, and automation risk. It’s a handy way to see the bigger picture at a glance.
Thousands of visitors cast their votes on how “automatable” each job feels. These community insights are shown alongside the calculated probabilities.
See how fast each occupation is projected to grow and what people earn on average. High wages don’t always mean high security — automation risk still matters.
Explore how many people currently work in each occupation and in which year the data was recorded. Popularity can affect how disruptive automation will be for the wider economy.
Each snowflake visualises the balance between automation risk, wages, growth, and job volume. Bigger and greener areas mean stronger performance in that dimension.
Use this comparison page to research careers, guide students, or simply explore the future of work. All data is regularly updated to keep the results relevant.