Automation Risk
Each occupation shows a probability of automation. A higher score means machines and algorithms are more likely to take over the role in the future.
| SUMMARY |
4%
Minimal Risk
|
10%
Minimal Risk
|
5%
Minimal Risk
|
5%
Minimal Risk
|
10%
Minimal Risk
|
| JOB SCORE | 7.8/10 | 7.3/10 | 7.2/10 | 8.0/10 | 8.0/10 |
| POLLING |
24%
(Low Risk,
Based on 67 votes)
|
21%
(Low Risk,
Based on 113 votes)
|
36%
(Low Risk,
Based on 48 votes)
|
11.2%
(Minimal Risk,
Based on 107 votes)
|
28%
(Low Risk,
Based on 321 votes)
|
|
GROWTH
by year 2034
|
11.5%
|
1.7%
|
11.5%
|
9.7%
|
16.8%
|
| WAGES |
$65,010
or $31.25 per hour
|
$80,190
or $38.55 per hour
|
$65,010
or $31.25 per hour
|
$60,060
or $28.87 per hour
|
$59,190
or $28.45 per hour
|
|
VOLUME
as of 2024
|
19,320
|
97,890
|
19,320
|
125,910
|
440,380
|
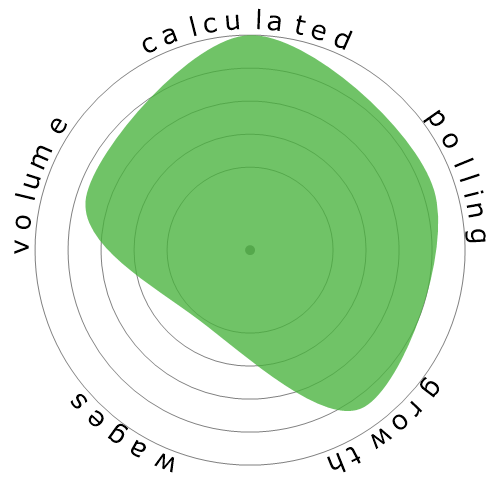
| SNOWFLAKE |
|
|
|
|
|
| DESCRIPTION | Plan or conduct art therapy sessions or programs to improve clients' physical, cognitive, or emotional well-being. | Teach courses in drama, music, and the arts including fine and applied art, such as painting and sculpture, or design and crafts. Includes both teachers primarily engaged in teaching and those who do a combination of teaching and research. | Plan, organize, direct, or assess clinical and evidenced-based music therapy interventions to positively influence individuals' physical, psychological, cognitive, or behavioral status. | Assess and treat individuals with mental, emotional, or substance abuse problems, including abuse of alcohol, tobacco, and/or other drugs. Activities may include individual and group therapy, crisis intervention, case management, client advocacy, prevention, and education. | Counsel and advise individuals and groups to promote optimum mental and emotional health, with an emphasis on prevention. May help individuals deal with a broad range of mental health issues, such as those associated with addictions and substance abuse; family, parenting, and marital problems; stress management; self-esteem; or aging. |
Curious how automation and AI could affect your career? Our comparison tool lets you view two or more jobs side by side, helping you quickly spot differences in risk level, pay, growth, and popularity. All of this is based on a mix of academic research, user polling, and official labour data.
Each occupation shows a probability of automation. A higher score means machines and algorithms are more likely to take over the role in the future.
A quick summary of how a job performs overall — factoring in wages, growth, volume, and automation risk. It’s a handy way to see the bigger picture at a glance.
Thousands of visitors cast their votes on how “automatable” each job feels. These community insights are shown alongside the calculated probabilities.
See how fast each occupation is projected to grow and what people earn on average. High wages don’t always mean high security — automation risk still matters.
Explore how many people currently work in each occupation and in which year the data was recorded. Popularity can affect how disruptive automation will be for the wider economy.
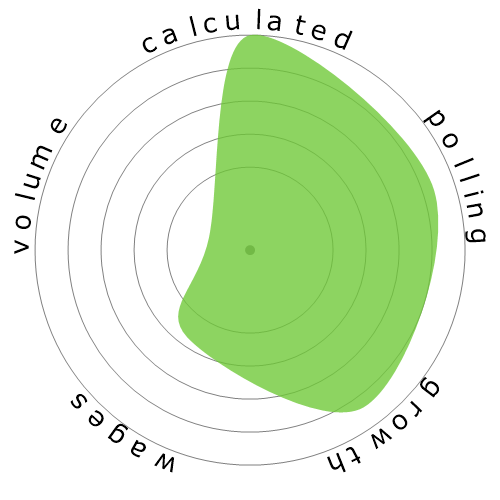
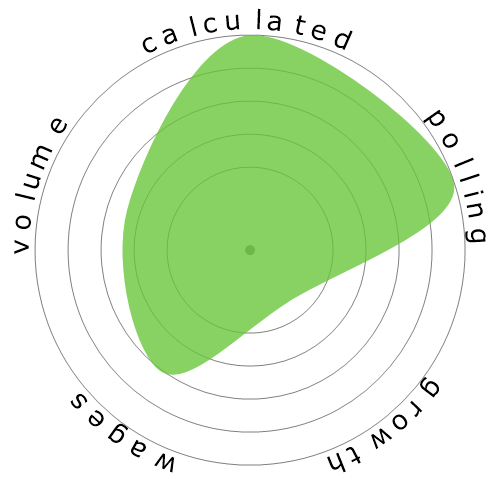
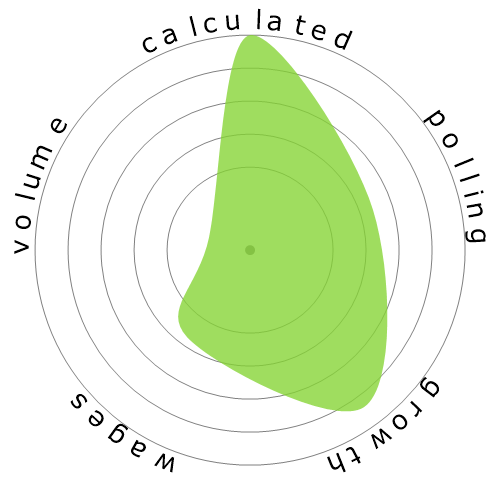
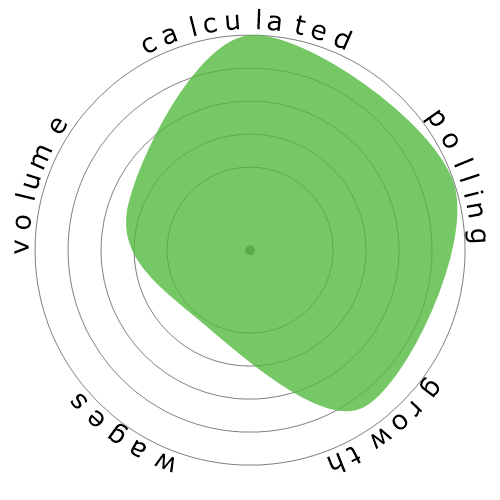
Each snowflake visualises the balance between automation risk, wages, growth, and job volume. Bigger and greener areas mean stronger performance in that dimension.
Use this comparison page to research careers, guide students, or simply explore the future of work. All data is regularly updated to keep the results relevant.