Automation Risk
Each occupation shows a probability of automation. A higher score means machines and algorithms are more likely to take over the role in the future.
| SUMMARY |
11%
Minimal Risk
|
19%
Minimal Risk
|
19%
Minimal Risk
|
20%
Low Risk
|
9%
Minimal Risk
|
| JOB SCORE | 7.0/10 | 6.1/10 | 7.1/10 | 7.4/10 | 6.0/10 |
| POLLING |
16.3%
(Minimal Risk,
Based on 26 votes)
|
38%
(Low Risk,
Based on 26 votes)
|
17.2%
(Minimal Risk,
Based on 67 votes)
|
26%
(Low Risk,
Based on 210 votes)
|
31%
(Low Risk,
Based on 29 votes)
|
|
GROWTH
by year 2034
|
3.4%
|
1.3%
|
7.0%
|
4.8%
|
4.1%
|
| WAGES |
$67,950
or $32.67 per hour
|
$74,720
or $35.92 per hour
|
$61,770
or $29.69 per hour
|
$69,780
or $33.55 per hour
|
$35,380
or $17.01 per hour
|
|
VOLUME
as of 2024
|
25,590
|
210,850
|
12,280
|
280,590
|
309,640
|
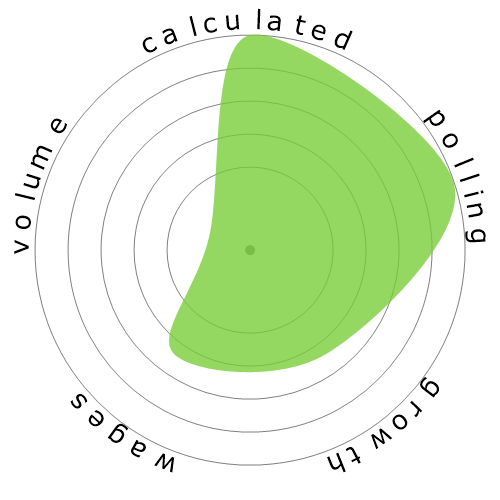
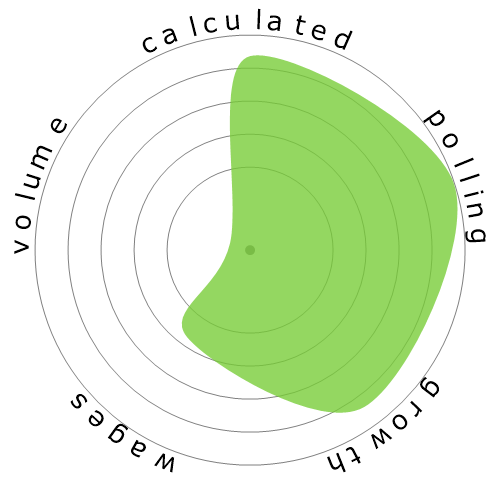
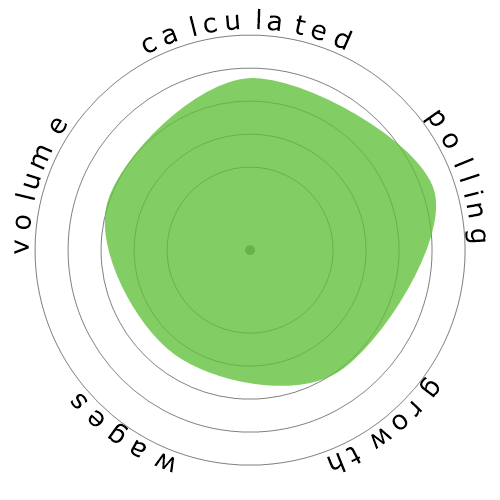
| SNOWFLAKE |
|

|
|
|

|
| DESCRIPTION | Plan, develop, and conduct programs to inform public of historical, natural, and scientific features of national, state, or local park. | Develop instructional material, coordinate educational content, and incorporate current technology into instruction in order to provide guidelines to educators and instructors for developing curricula and conducting courses. May train and coach teachers. Includes educational consultants and specialists, and instructional material directors. | Administer collections, such as artwork, collectibles, historic items, or scientific specimens of museums or other institutions. May conduct instructional, research, or public service activities of institution. | Promote or create an intended public image for individuals, groups, or organizations. May write or select material for release to various communications media. May specialize in using social media. | Conduct recreation activities with groups in public, private, or volunteer agencies or recreation facilities. Organize and promote activities, such as arts and crafts, sports, games, music, dramatics, social recreation, camping, and hobbies, taking into account the needs and interests of individual members. |
Curious how automation and AI could affect your career? Our comparison tool lets you view two or more jobs side by side, helping you quickly spot differences in risk level, pay, growth, and popularity. All of this is based on a mix of academic research, user polling, and official labour data.
Each occupation shows a probability of automation. A higher score means machines and algorithms are more likely to take over the role in the future.
A quick summary of how a job performs overall — factoring in wages, growth, volume, and automation risk. It’s a handy way to see the bigger picture at a glance.
Thousands of visitors cast their votes on how “automatable” each job feels. These community insights are shown alongside the calculated probabilities.
See how fast each occupation is projected to grow and what people earn on average. High wages don’t always mean high security — automation risk still matters.
Explore how many people currently work in each occupation and in which year the data was recorded. Popularity can affect how disruptive automation will be for the wider economy.
Each snowflake visualises the balance between automation risk, wages, growth, and job volume. Bigger and greener areas mean stronger performance in that dimension.
Use this comparison page to research careers, guide students, or simply explore the future of work. All data is regularly updated to keep the results relevant.