Automation Risk
Each occupation shows a probability of automation. A higher score means machines and algorithms are more likely to take over the role in the future.
| SUMMARY |
20%
Minimal Risk
|
9%
Minimal Risk
|
10%
Minimal Risk
|
10%
Minimal Risk
|
5%
Minimal Risk
|
14%
Minimal Risk
|
| JOB SCORE | 7.0/10 | 7.5/10 | 8.5/10 | 7.7/10 | 8.2/10 | 6.1/10 |
| POLLING |
36%
(Low Risk,
Based on 28 votes)
|
31%
(Low Risk,
Based on 105 votes)
|
35%
(Low Risk,
Based on 126 votes)
|
43%
(Moderate Risk,
Based on 15 votes)
|
20%
(Low Risk,
Based on 56 votes)
|
28%
(Low Risk,
Based on 15 votes)
|
|
GROWTH
by year 2034
|
4.5%
|
16.2%
|
23.2%
|
17.3%
|
16.8%
|
11.3%
|
| WAGES |
$63,000
or $30.29 per hour
|
$83,980
or $40.37 per hour
|
$117,960
or $56.71 per hour
|
$105,620
or $50.77 per hour
|
$59,190
or $28.45 per hour
|
$51,030
or $24.53 per hour
|
|
VOLUME
as of 2024
|
65,150
|
11,460
|
565,840
|
229,720
|
440,380
|
60,730
|
| SNOWFLAKE |

|
|
|
|
|

|
| DESCRIPTION | Provide and manage health education programs that help individuals, families, and their communities maximize and maintain healthy lifestyles. Use data to identify community needs prior to planning, implementing, monitoring, and evaluating programs designed to encourage healthy lifestyles, policies, and environments. May link health systems, health providers, insurers, and patients to address individual and population health needs. May serve as resource to assist individuals, other health professionals, or the community, and may administer fiscal resources for health education programs. | Investigate and describe the determinants and distribution of disease, disability, or health outcomes. May develop the means for prevention and control. | Plan, direct, or coordinate medical and health services in hospitals, clinics, managed care organizations, public health agencies, or similar organizations. | Teach courses in health specialties, in fields such as dentistry, laboratory technology, medicine, pharmacy, public health, therapy, and veterinary medicine. | Counsel and advise individuals with alcohol, tobacco, drug, or other problems, such as gambling and eating disorders. May counsel individuals, families, or groups or engage in prevention programs. | Promote health within a community by assisting individuals to adopt healthy behaviors. Serve as an advocate for the health needs of individuals by assisting community residents in effectively communicating with healthcare providers or social service agencies. Act as liaison or advocate and implement programs that promote, maintain, and improve individual and overall community health. May deliver health-related preventive services such as blood pressure, glaucoma, and hearing screenings. May collect data to help identify community health needs. |
Curious how automation and AI could affect your career? Our comparison tool lets you view two or more jobs side by side, helping you quickly spot differences in risk level, pay, growth, and popularity. All of this is based on a mix of academic research, user polling, and official labour data.
Each occupation shows a probability of automation. A higher score means machines and algorithms are more likely to take over the role in the future.
A quick summary of how a job performs overall — factoring in wages, growth, volume, and automation risk. It’s a handy way to see the bigger picture at a glance.
Thousands of visitors cast their votes on how “automatable” each job feels. These community insights are shown alongside the calculated probabilities.
See how fast each occupation is projected to grow and what people earn on average. High wages don’t always mean high security — automation risk still matters.
Explore how many people currently work in each occupation and in which year the data was recorded. Popularity can affect how disruptive automation will be for the wider economy.
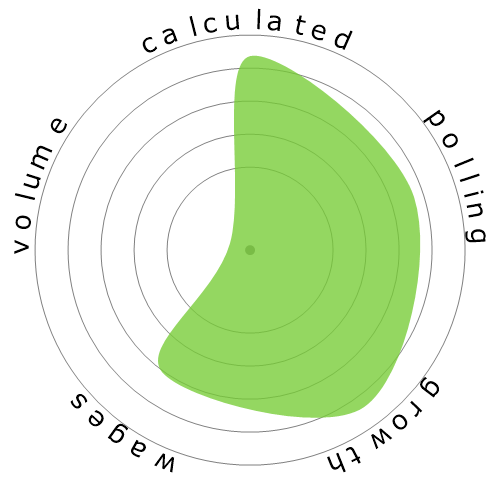
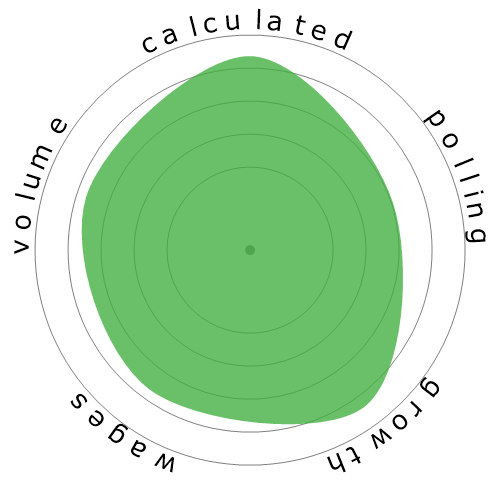
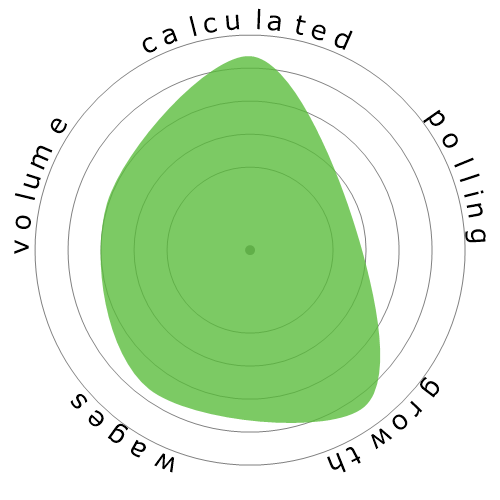
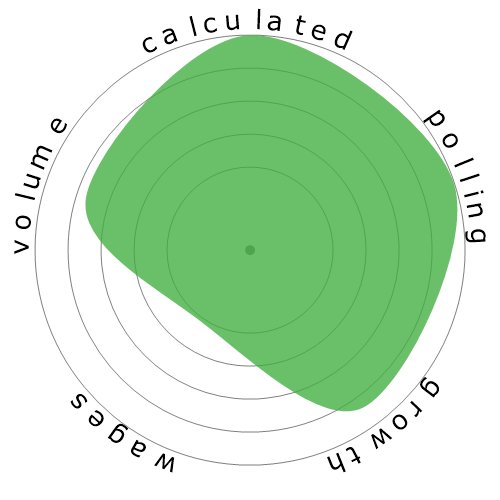
Each snowflake visualises the balance between automation risk, wages, growth, and job volume. Bigger and greener areas mean stronger performance in that dimension.
Use this comparison page to research careers, guide students, or simply explore the future of work. All data is regularly updated to keep the results relevant.