Automation Risk
Each occupation shows a probability of automation. A higher score means machines and algorithms are more likely to take over the role in the future.
| SUMMARY |
40%
Moderate Risk
|
9%
Minimal Risk
|
25%
Low Risk
|
33%
Low Risk
|
28%
Low Risk
|
24%
Low Risk
|
| JOB SCORE | 3.5/10 | 5.8/10 | 5.0/10 | 5.5/10 | 4.1/10 | 5.1/10 |
| POLLING |
There hasn't been enough votes on this occupation yet
|
17.9%
(Minimal Risk,
Based on 60 votes)
|
41%
(Moderate Risk,
Based on 24 votes)
|
37%
(Low Risk,
Based on 197 votes)
|
There hasn't been enough votes on this occupation yet
|
There hasn't been enough votes on this occupation yet
|
|
GROWTH
by year 2034
|
-2.5%
|
-6.0%
|
2.5%
|
0.5%
|
-3.2%
|
4.0%
|
| WAGES |
$36,750
or $17.67 per hour
|
$68,180
or $32.78 per hour
|
$59,330
or $28.52 per hour
|
$85,540
or $41.12 per hour
|
$54,310
or $26.11 per hour
|
$49,490
or $23.79 per hour
|
|
VOLUME
as of 2024
|
442,050
|
6,420
|
29,530
|
35,390
|
31,080
|
39,390
|
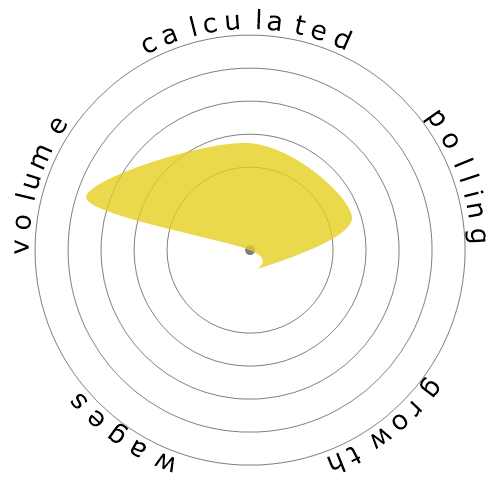
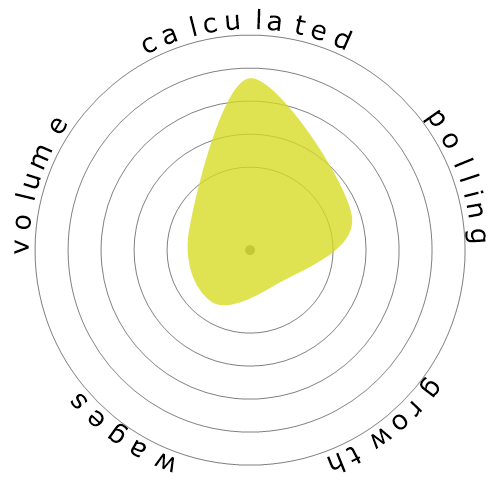
| SNOWFLAKE |
|

|

|

|
|

|
| DESCRIPTION | Hunt, trap, catch, or gather wild animals or aquatic animals and plants. May use nets, traps, or other equipment. May haul catch onto ship or other vessel. | Patrol assigned area to prevent fish and game law violations. Investigate reports of damage to crops or property by wildlife. Compile biological data. | Directly supervise and coordinate the activities of agricultural, forestry, aquacultural, and related workers. | Command or supervise operations of ships and water vessels, such as tugboats and ferryboats. Required to hold license issued by U.S. Coast Guard. | Provide technical assistance regarding the conservation of soil, water, forests, or related natural resources. May compile data pertaining to size, content, condition, and other characteristics of forest tracts under the direction of foresters, or train and lead forest workers in forest propagation and fire prevention and suppression. May assist conservation scientists in managing, improving, and protecting rangelands and wildlife habitats. | Perform laboratory and field tests to monitor the environment and investigate sources of pollution, including those that affect health, under the direction of an environmental scientist, engineer, or other specialist. May collect samples of gases, soil, water, and other materials for testing. |
Curious how automation and AI could affect your career? Our comparison tool lets you view two or more jobs side by side, helping you quickly spot differences in risk level, pay, growth, and popularity. All of this is based on a mix of academic research, user polling, and official labour data.
Each occupation shows a probability of automation. A higher score means machines and algorithms are more likely to take over the role in the future.
A quick summary of how a job performs overall — factoring in wages, growth, volume, and automation risk. It’s a handy way to see the bigger picture at a glance.
Thousands of visitors cast their votes on how “automatable” each job feels. These community insights are shown alongside the calculated probabilities.
See how fast each occupation is projected to grow and what people earn on average. High wages don’t always mean high security — automation risk still matters.
Explore how many people currently work in each occupation and in which year the data was recorded. Popularity can affect how disruptive automation will be for the wider economy.
Each snowflake visualises the balance between automation risk, wages, growth, and job volume. Bigger and greener areas mean stronger performance in that dimension.
Use this comparison page to research careers, guide students, or simply explore the future of work. All data is regularly updated to keep the results relevant.