Automation Risk
Each occupation shows a probability of automation. A higher score means machines and algorithms are more likely to take over the role in the future.
| SUMMARY |
10%
Minimal Risk
|
10%
Minimal Risk
|
10%
Minimal Risk
|
9%
Minimal Risk
|
15%
Minimal Risk
|
| JOB SCORE | 8.1/10 | 7.8/10 | 8.1/10 | 7.7/10 | 7.3/10 |
| POLLING |
26%
(Low Risk,
Based on 756 votes)
|
29%
(Low Risk,
Based on 40 votes)
|
24%
(Low Risk,
Based on 76 votes)
|
28%
(Low Risk,
Based on 200 votes)
|
29%
(Low Risk,
Based on 133 votes)
|
|
GROWTH
by year 2034
|
11.2%
|
4.3%
|
4.3%
|
6.3%
|
3.5%
|
| WAGES |
$95,830
or $46.07 per hour
|
$117,580
or $56.52 per hour
|
$117,580
or $56.52 per hour
|
$109,840
or $52.80 per hour
|
$65,140
or $31.31 per hour
|
|
VOLUME
as of 2024
|
72,190
|
17,790
|
17,790
|
1,050
|
342,350
|
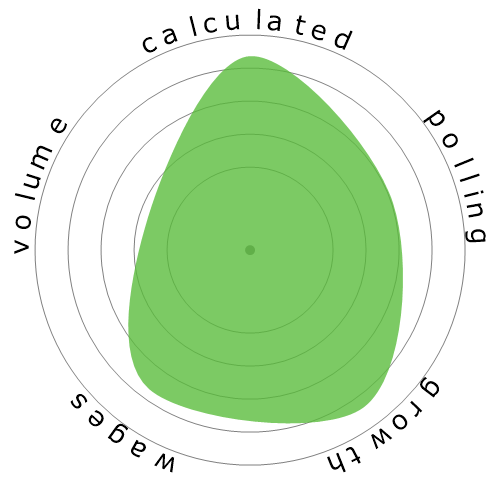
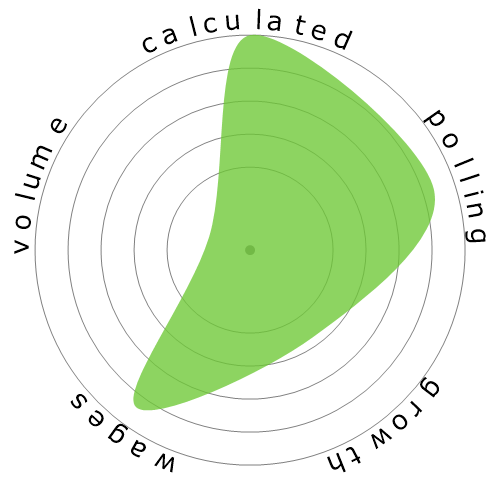
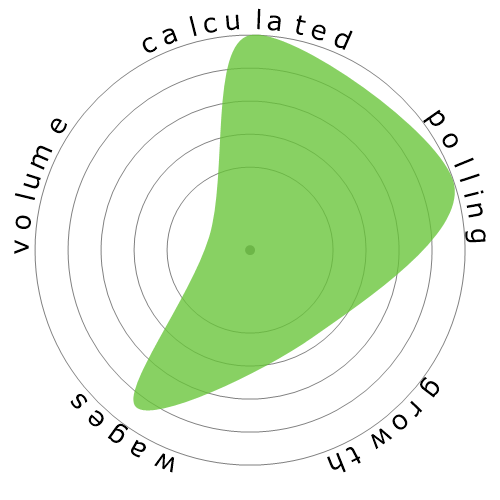
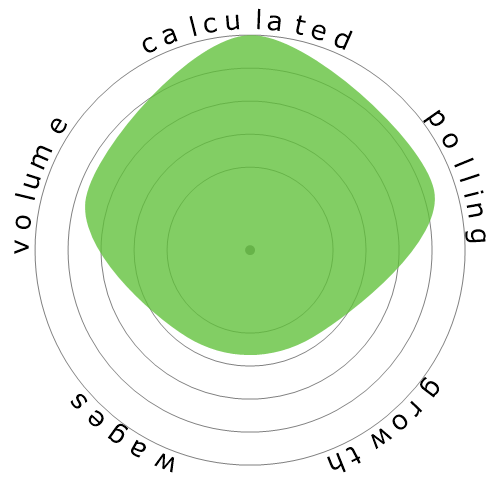
| SNOWFLAKE |
|
|
|

|
|
| DESCRIPTION | Assess, diagnose, and treat mental and emotional disorders of individuals through observation, interview, and psychological tests. Help individuals with distress or maladjustment understand their problems through their knowledge of case history, interviews with patients, and theory. Provide individual or group counseling services to assist individuals in achieving more effective personal, social, educational, and vocational development and adjustment. May design behavior modification programs and consult with medical personnel regarding the best treatment for patients. | Assess and diagnose patients with neurobehavioral problems related to acquired or developmental disorders of the nervous system, such as neurodegenerative disorders, traumatic brain injury, seizure disorders, and learning disabilities. Recommend treatment after diagnosis, such as therapy, medication, or surgery. Assist with evaluation before and after neurosurgical procedures, such as deep brain stimulation. | Apply theories and principles of neuropsychology to evaluate and diagnose disorders of higher cerebral functioning, often in research and medical settings. Study the human brain and the effect of physiological states on human cognition and behavior. May formulate and administer programs of treatment. | Apply principles of psychology to human resources, administration, management, sales, and marketing problems. Activities may include policy planning; employee testing and selection, training, and development; and organizational development and analysis. May work with management to organize the work setting to improve worker productivity. | Advise and assist students and provide educational and vocational guidance services. |
Curious how automation and AI could affect your career? Our comparison tool lets you view two or more jobs side by side, helping you quickly spot differences in risk level, pay, growth, and popularity. All of this is based on a mix of academic research, user polling, and official labour data.
Each occupation shows a probability of automation. A higher score means machines and algorithms are more likely to take over the role in the future.
A quick summary of how a job performs overall — factoring in wages, growth, volume, and automation risk. It’s a handy way to see the bigger picture at a glance.
Thousands of visitors cast their votes on how “automatable” each job feels. These community insights are shown alongside the calculated probabilities.
See how fast each occupation is projected to grow and what people earn on average. High wages don’t always mean high security — automation risk still matters.
Explore how many people currently work in each occupation and in which year the data was recorded. Popularity can affect how disruptive automation will be for the wider economy.
Each snowflake visualises the balance between automation risk, wages, growth, and job volume. Bigger and greener areas mean stronger performance in that dimension.
Use this comparison page to research careers, guide students, or simply explore the future of work. All data is regularly updated to keep the results relevant.